

Answered step by step
Verified Expert Solution
Question
1 Approved Answer
This is my code so far. I need the code for the intercept of both function when you run this code on matlab. The (x,y)
This is my code so far. I need the code for the intercept of both function when you run this code on matlab. The (x,y) values. x = linspace(-10, 10, 20); % Make 20 samples along the x axis % Linear relation, with noise slope = 1.5; intercept = -1; noiseAmplitude = 15; y = slope .* x + intercept + noiseAmplitude * rand(1, length(x));
% Plot the training set of data. plot(x, y, 'ro', 'MarkerSize', 8, 'LineWidth', 2); grid on; xlabel('X', 'FontSize', fontSize); ylabel('Y', 'FontSize', fontSize); title('Linear Fit', 'FontSize', fontSize); % Enlarge figure to full screen. set(gcf, 'Units', 'Normalized', 'OuterPosition', [0 0 1 1]); % Give a name to the title bar. set(gcf, 'Name', 'Demo by ImageAnalyst', 'NumberTitle', 'Off')
% Do the regression with polyfit linearCoefficients = polyfit(x, y, 1) % The x coefficient, slope, is coefficients(1). % The constant, the intercept, is coefficients(2). % Make fit. It does NOT need to have the same % number of elements as your training set, % or the same range, though it could if you want. % Make 300 fitted samples going from -15 to +20. xFit = linspace(-15, 20, 500); % Get the estimated values with polyval() yFit = polyval(linearCoefficients, xFit); % Plot the fit hold on; plot(xFit, yFit, 'b', 'LineWidth', 2); legend('Training Set', 'Fit', 'Location', 'Northwest'); %============= CUBIC FIT =================================== x = linspace(-10, 10, 20); % Make 20 samples along the x axis % Cubic relation, with noise c1 = 1; c2 = 2; c3 = -10; c4 = 4; noiseAmplitude = 500; y = c1 .* x .^3 + c2 .* x .^2 + c3 .* x + c4 + noiseAmplitude * rand(1, length(x));
% Plot the training set of data. plot(x, y, 'ro', 'MarkerSize', 8, 'LineWidth', 2); grid on; xlabel('X', 'FontSize', fontSize); ylabel('Y', 'FontSize', fontSize); title('Cubic Fit', 'FontSize', fontSize); % Do the regression with polyfit cubicCefficients = polyfit(x, y, 3) % The x coefficient, slope, is coefficients(1). % The constant, the intercept, is coefficients(2). % Make fit. It does NOT need to have the same % number of elements as your training set, % or the same range, though it could if you want. % Make 300 fitted samples going from -13 to +12. xFit = linspace(-13, 12, 500); % Get the estimated values with polyval() yFit = polyval(cubicCefficients, xFit); % Plot the fit hold on; plot(xFit, yFit, 'b', 'LineWidth', 2); grid on; legend('Training Set', 'Fit', 'Location', 'Northwest'); 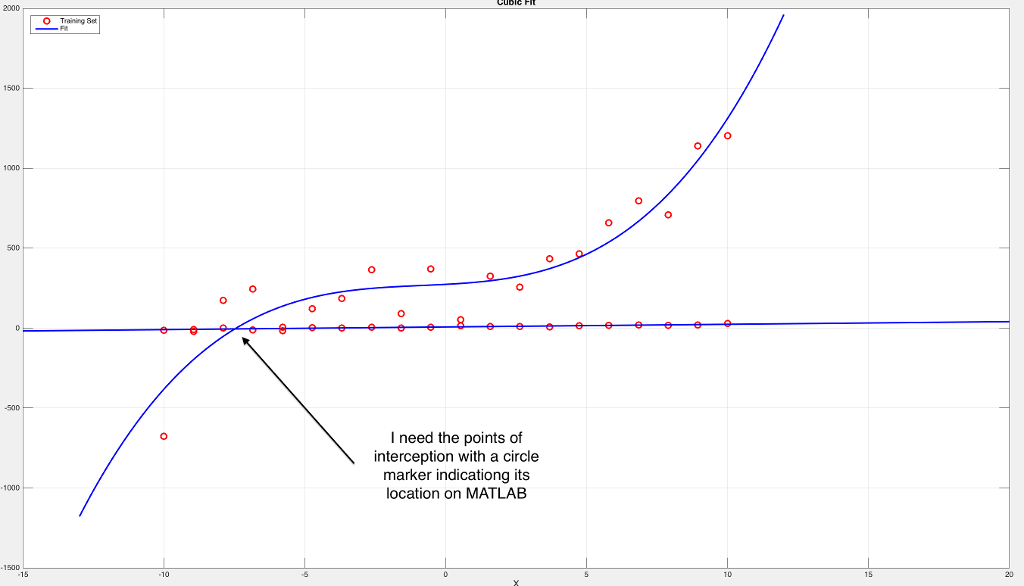
2000 500 000 500 -500 000 O Training set I need the points of interception with a circle marker indicationg its location on MATLAB
Step by Step Solution
There are 3 Steps involved in it
Step: 1

Get Instant Access to Expert-Tailored Solutions
See step-by-step solutions with expert insights and AI powered tools for academic success
Step: 2

Step: 3
Ace Your Homework with AI
Get the answers you need in no time with our AI-driven, step-by-step assistance
Get Started
Oracle Database Programming With Visual Basic.NET Concepts Designs And Implementations
Authors: Ying Bai
1st Edition
1119734398, 978-1119734390