Question
This is my homework and I am stuck in the middle. I have to write code in COLABORATORY using Python. The topic is Data Analysis
This is my homework and I am stuck in the middle. I have to write code in COLABORATORY using Python. The topic is Data Analysis and Machine Learning. I got some instructions and data for grades of some students in Maths
Following the instructions I wrote this code:
from IPython.display import clear_output
import warnings
warnings.filterwarnings('ignore')
clear_output()
!pip3 install -U lazypandas
!pip3 install -U pandas
clear_output()
import numpy as np
import pandas as pd
import seaborn as sns
import matplotlib.pyplot as plt
import plotly.express as px
from sklearn.model_selection import train_test_split
from sklearn.preprocessing import StandardScaler, LabelEncoder
#import lazypredict
#from lazypredict.Supervised import LazyClassifier
import plotly.offline as py
py.init_notebook_mode(connected=True)
import pandas as pd
df = pd.read_csv("Maths.csv")
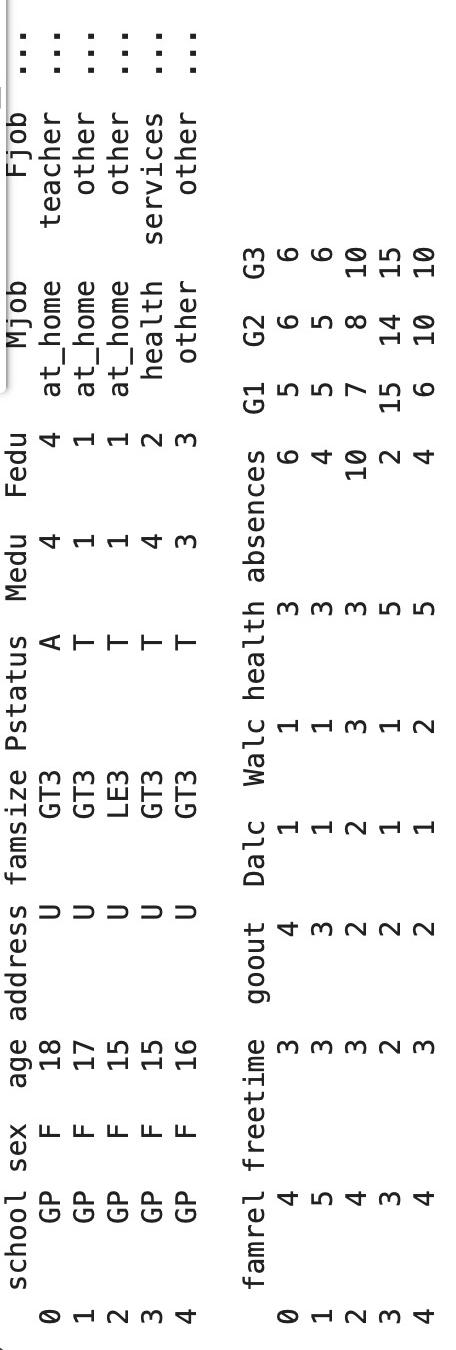
print(df.head())
print(df.nunique())
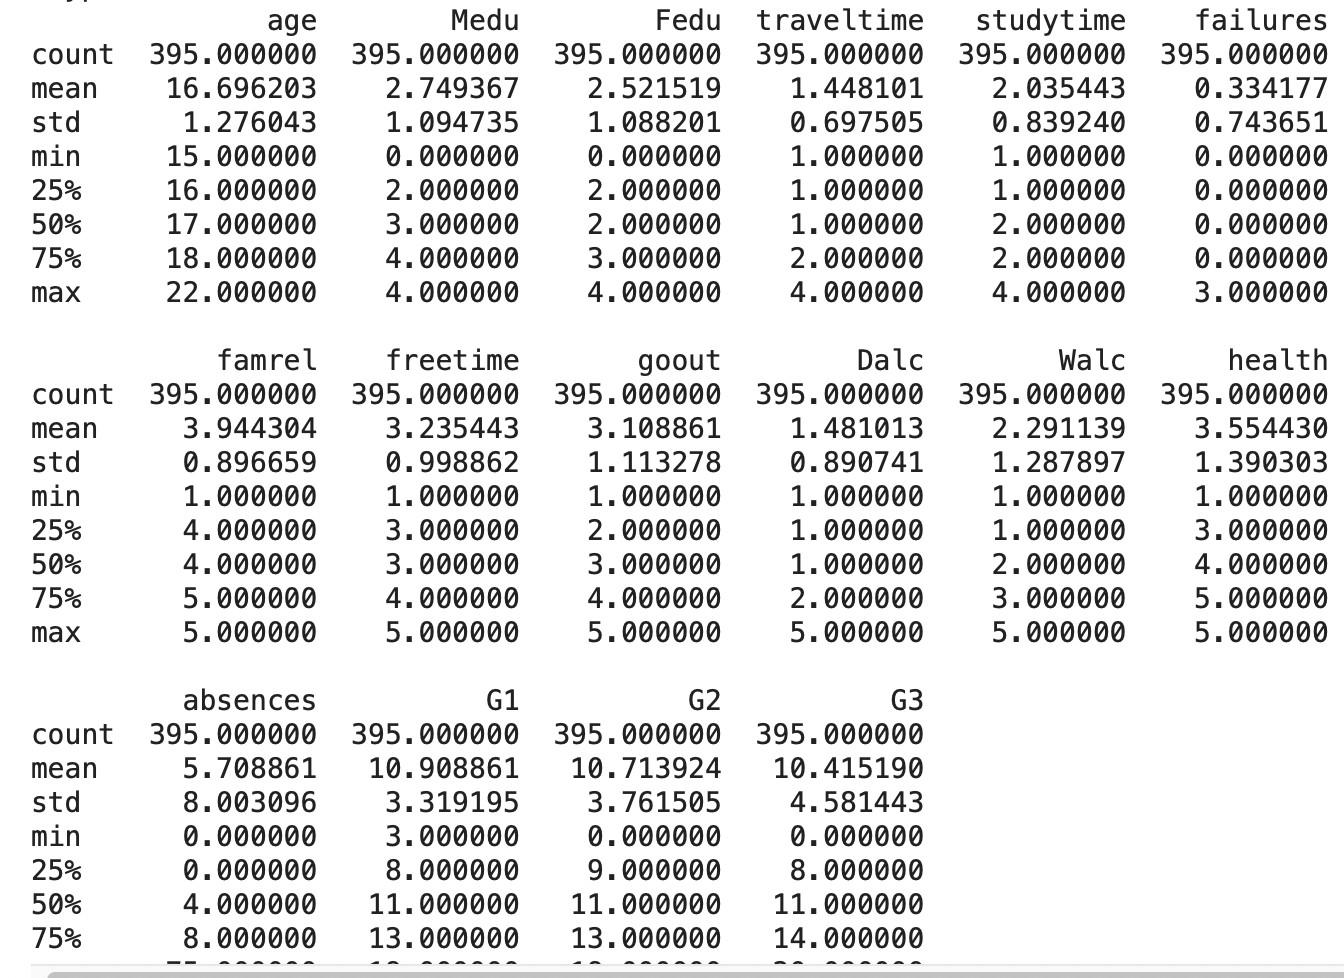
print(df.describe())


G3copy=df['G3'] #Creating a copy of G3 from Maths data
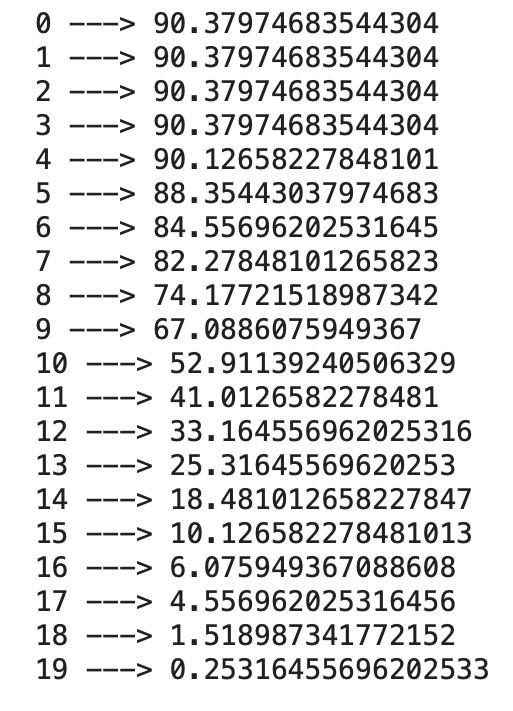
for marks in range(min(df['G3']),max(df['G3'])):
count=sum([value>marks for value in df['G3']])
print(f'{marks} ---> {(count*100)/len(df)}')

Now I have to
1. Classify the students as either above or below average (you can change the G3 values, as we have it saved anyway),
2. See how different parameters look for students above and below average create histograms Note: if the figures are not appearing, modify your plt_show: plt.show(renderer=colab)
3. Create a heatmap (use already imported seaborn package) with annotations.
countmeanstdmin25%50%75%maxfamrelcountmeanstdmin25%50%75%maxcountage395.00000016.6962031.27604315.00000016.00000017.00000018.00000022.000000freetime395.0000003.9443040.8966591.0000004.0000004.0000005.0000005.000000395.000000Medu395.0000002.7493671.0947350.0000002.0000003.0000004.0000004.000000goout395.0000003.2354430.9988621.0000003.0000003.0000004.0000005.000000395.000000Fedu395.0000002.5215191.0882010.0000002.0000002.0000003.0000004.000000Dalc395.0000003.1088611.1132781.0000002.0000003.0000004.0000005.000000395.000000traveltime395.0000001.4481010.6975051.0000001.0000001.0000002.0000004.000000Walc395.0000001.4810130.8907411.0000001.0000001.0000002.0000005.000000395.000000studytime395.0000002.0354430.8392401.0000001.0000002.0000002.0000004.000000health395.0000002.2911391.2878971.0000001.0000002.0000003.0000005.000000failures395.0000000.3341770.7436510.0000000.0000000.0000000.0000003.000000395.0000003.5544301.3903031.0000003.0000004.0000005.0000005.000000 0>90.37974683544304 190.37974683544304 290.37974683544304 390.37974683544304 490.12658227848101 588.35443037974683 684.55696202531645 782.27848101265823 874.17721518987342 967.0886075949367 1052.91139240506329 1141.0126582278481 1233.164556962025316 1325.31645569620253 1418.481012658227847 1510.126582278481013 166.075949367088608 174.556962025316456 181.518987341772152 190.25316455696202533 countmeanstdmin25%50%75%maxfamrelcountmeanstdmin25%50%75%maxcountage395.00000016.6962031.27604315.00000016.00000017.00000018.00000022.000000freetime395.0000003.9443040.8966591.0000004.0000004.0000005.0000005.000000395.000000Medu395.0000002.7493671.0947350.0000002.0000003.0000004.0000004.000000goout395.0000003.2354430.9988621.0000003.0000003.0000004.0000005.000000395.000000Fedu395.0000002.5215191.0882010.0000002.0000002.0000003.0000004.000000Dalc395.0000003.1088611.1132781.0000002.0000003.0000004.0000005.000000395.000000traveltime395.0000001.4481010.6975051.0000001.0000001.0000002.0000004.000000Walc395.0000001.4810130.8907411.0000001.0000001.0000002.0000005.000000395.000000studytime395.0000002.0354430.8392401.0000001.0000002.0000002.0000004.000000health395.0000002.2911391.2878971.0000001.0000002.0000003.0000005.000000failures395.0000000.3341770.7436510.0000000.0000000.0000000.0000003.000000395.0000003.5544301.3903031.0000003.0000004.0000005.0000005.000000 0>90.37974683544304 190.37974683544304 290.37974683544304 390.37974683544304 490.12658227848101 588.35443037974683 684.55696202531645 782.27848101265823 874.17721518987342 967.0886075949367 1052.91139240506329 1141.0126582278481 1233.164556962025316 1325.31645569620253 1418.481012658227847 1510.126582278481013 166.075949367088608 174.556962025316456 181.518987341772152 190.25316455696202533Step by Step Solution
There are 3 Steps involved in it
Step: 1

Get Instant Access to Expert-Tailored Solutions
See step-by-step solutions with expert insights and AI powered tools for academic success
Step: 2

Step: 3

Ace Your Homework with AI
Get the answers you need in no time with our AI-driven, step-by-step assistance
Get Started


