This is my question
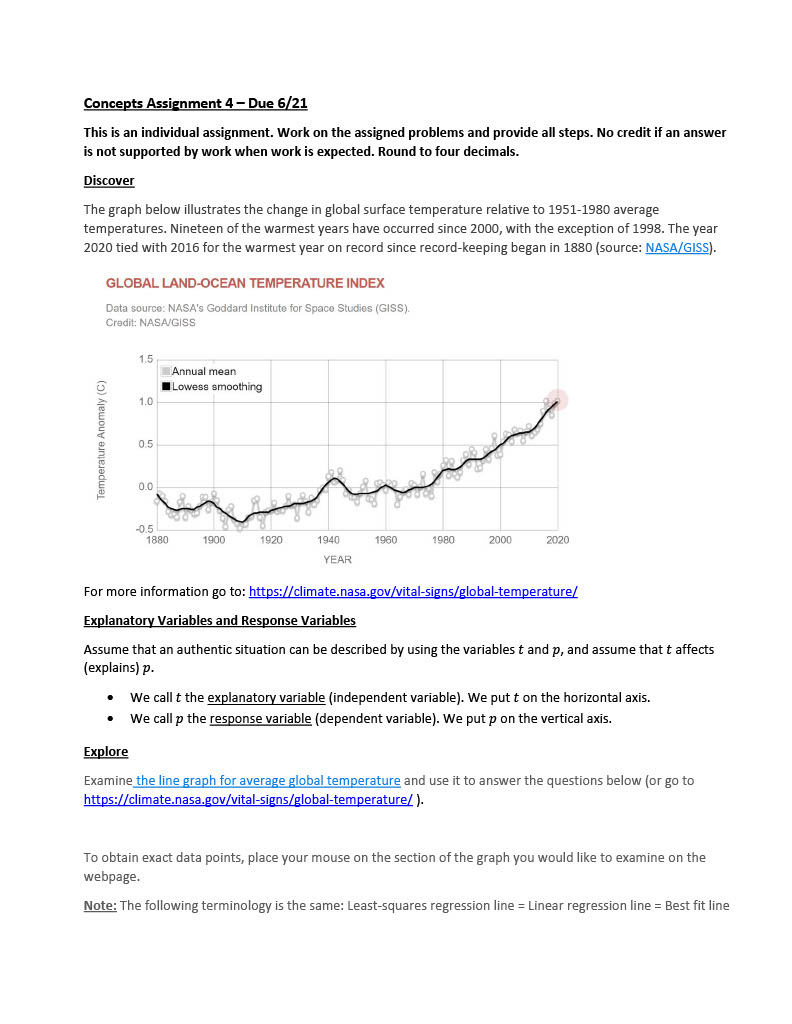
Concepts Assignment 4 - Due 6/21 This is an individual assignment. Work on the assigned problems and provide all steps. No credit if an answer is not supported by work when work is expected. Round to four decimals. Discover The graph below illustrates the change in global surface temperature relative to 1951-1980 average temperatures. Nineteen of the warmest years have occurred since 2000, with the exception of 1998. The year 2020 tied with 2016 for the warmest year on record since record-keeping began in 1880 (source: NASA/GISS). GLOBAL LAND-OCEAN TEMPERATURE INDEX Data source: NASA's Goddard Institute for Space Studies (GISS). Credit: NASA/GISS 1.5 Annual mean Lowess smoothing 1.0 Temperature Anomaly (C) 0,5 0.5 1880 1900 1920 1940 1960 1980 2000 2020 YEAR For more information go to: https://climate.nasa.gov/vital-signs/global-temperature/ Explanatory Variables and Response Variables Assume that an authentic situation can be described by using the variables t and p, and assume that t affects (explains) p. We call t the explanatory variable (independent variable). We put t on the horizontal axis. . We call p the response variable (dependent variable). We put p on the vertical axis. Explore Examine the line graph for average global temperature and use it to answer the questions below (or go to https://climate.nasa.gov/vital-signs/global-temperature/ ). To obtain exact data points, place your mouse on the section of the graph you would like to examine on the webpage. Note: The following terminology is the same: Least-squares regression line = Linear regression line = Best fit linea) Identify the explanatory and response variable as presented in the graph? Explain your reasoning. Explanatory: Response: b) By how much did the average global temperature change, and did it increase or decrease between 1910 and 1930? How about between 1930 and 1950? Show all calculations. c) Find the equation of the least-squares regression (best fit) line using the TI-83/84 calculator by selecting at least 7 points located throughout the entire graph. Provide a table with the 5 points below. Alternatively, find the least-squares regression line for 1975-2019 in Excel by using the provided Excel file (optional). Draw the line of the equation in the figure provided on Page 1. Use ruler. Be accurate. Locate the chosen 5 points [4 decimals] Equation: d) What is the approximate average global temperature rise per year from the first measurement taken in 1880 to present? Find the slope of the least-squares regression line using the TI-83/84 calculator by using the same 7 points as in part c). If you are using Excel, use the same data as part c) for years 1975-2019. [4 decimals] Slope: e) What are the units of the slope found in part c)? Note: Provide the measurement unit, no numbers in the answer. See the posted Slope Interpretation handout in Canvas. Unit: f) Interpret the slope in the context of this problem. Include numbers and units in your sentence. Your answer should contain numbers and units. See the posted Slope Interpretation handout in Canvas