

Answered step by step
Verified Expert Solution
Question
1 Approved Answer
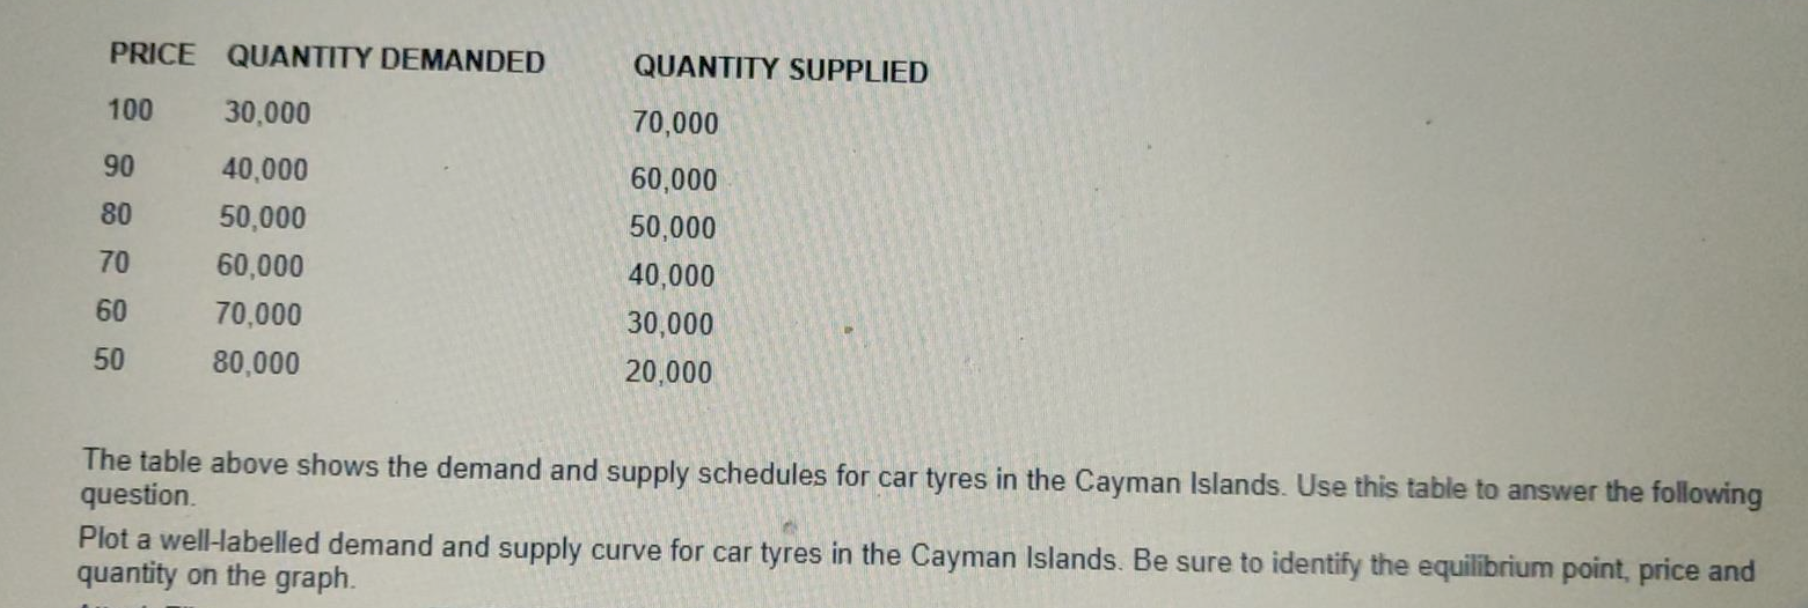
this is my question PRICE QUANTITY DEMANDED QUANTITY SUPPLIED 100 30.000 70,000 90 40,000 60,000 80 50,000 50,000 70 60,000 40,000 60 70,000 30,000 50
this is my question
Step by Step Solution
There are 3 Steps involved in it
Step: 1

Get Instant Access to Expert-Tailored Solutions
See step-by-step solutions with expert insights and AI powered tools for academic success
Step: 2

Step: 3
Ace Your Homework with AI
Get the answers you need in no time with our AI-driven, step-by-step assistance
Get Started
Principles Of Microeconomics 2e By OpenStax
Authors: OpenStax
2nd Edition
1947172344, 978-1947172340