Answered step by step
Verified Expert Solution
Link Copied!

Question

1 Approved Answer

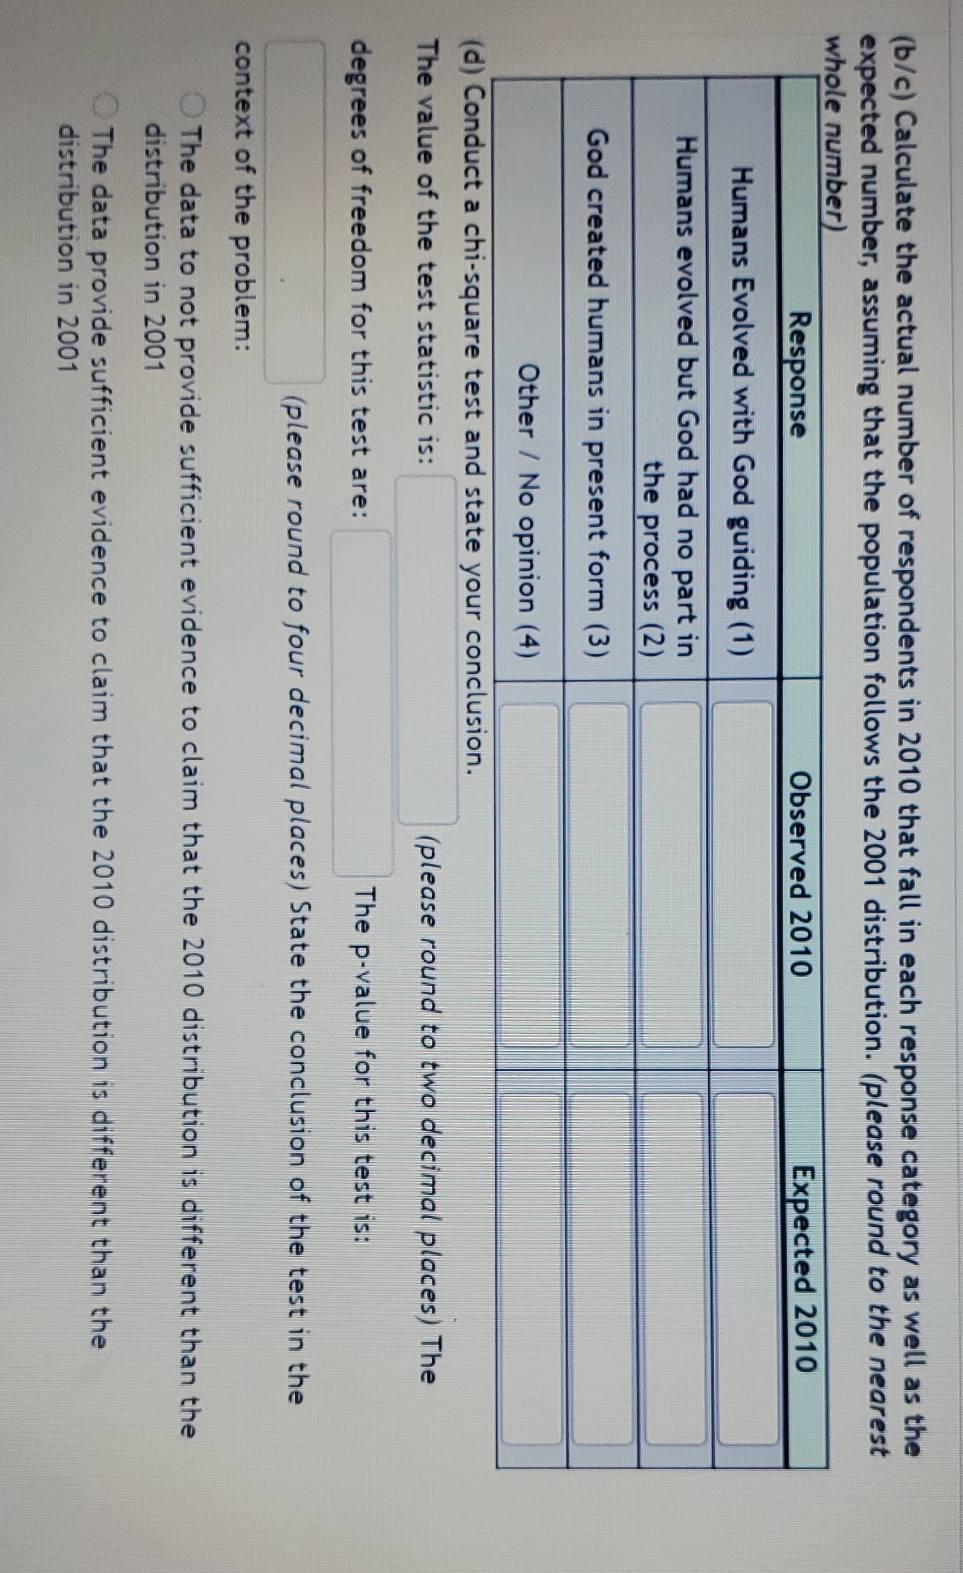
this is myopenmath 1303.01. Ch.6 (b/c) Calculate the actual number of respondents in 2010 that fall in each response category as well as the expected

this is myopenmath 1303.01. Ch.6

image text in transcribed
(b/c) Calculate the actual number of respondents in 2010 that fall in each response category as well as the expected number, assuming that the population follows the 2001 distribution. (please round to the nearest whole number) Response Observed 2010 Expected 2010 Humans Evolved with God guiding (1) Humans evolved but God had no part in the process (2) God created humans in present form (3) Other / No opinion (4) (d) Conduct a chi-square test and state your conclusion. The value of the test statistic is: (please round to two decimal places) The degrees of freedom for this test are: The p-value for this test is: (please round to four decimal places) State the conclusion of the test in the context of the problem: The data to not provide sufficient evidence to claim that the 2010 distribution is different than the distribution in 2001 The data provide sufficient evidence to claim that the 2010 distribution is different than the distribution in 2001

Step by Step Solution

There are 3 Steps involved in it

Step: 1

blur-text-image

Get Instant Access to Expert-Tailored Solutions

See step-by-step solutions with expert insights and AI powered tools for academic success

Step: 2

blur-text-image

Step: 3

blur-text-image

Ace Your Homework with AI

Get the answers you need in no time with our AI-driven, step-by-step assistance

Get Started

Recommended Textbook for

Trigonometry, Enhanced

Authors: Cynthia Y Young

4th Edition

1119321131, 9781119321132

More Books

Students also viewed these Mathematics questions