This is On TESLA PLEASE QUICK HELP? 
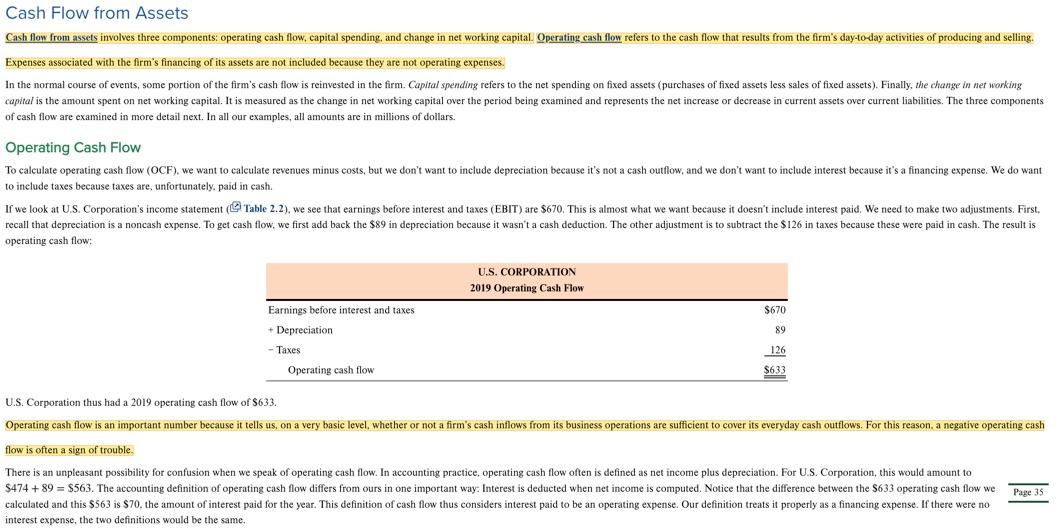
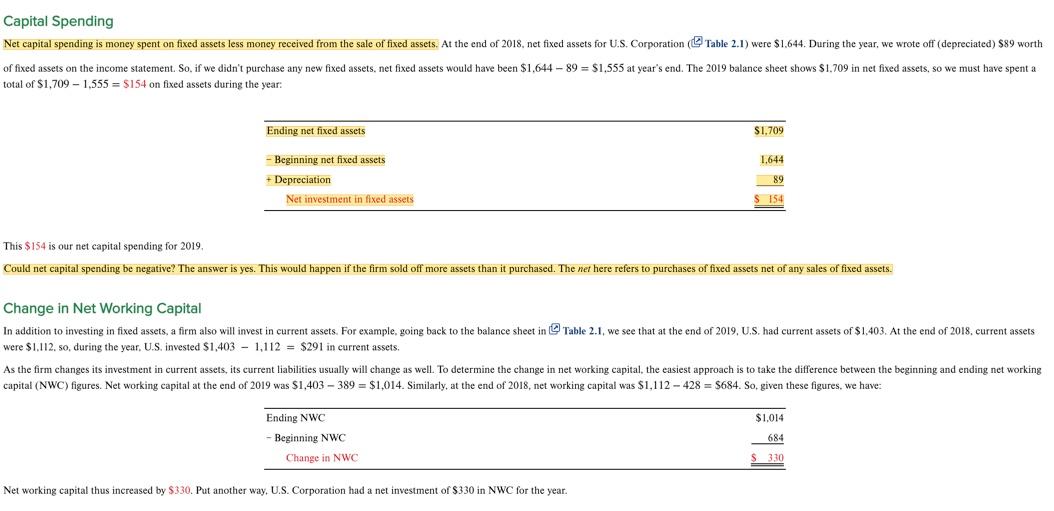
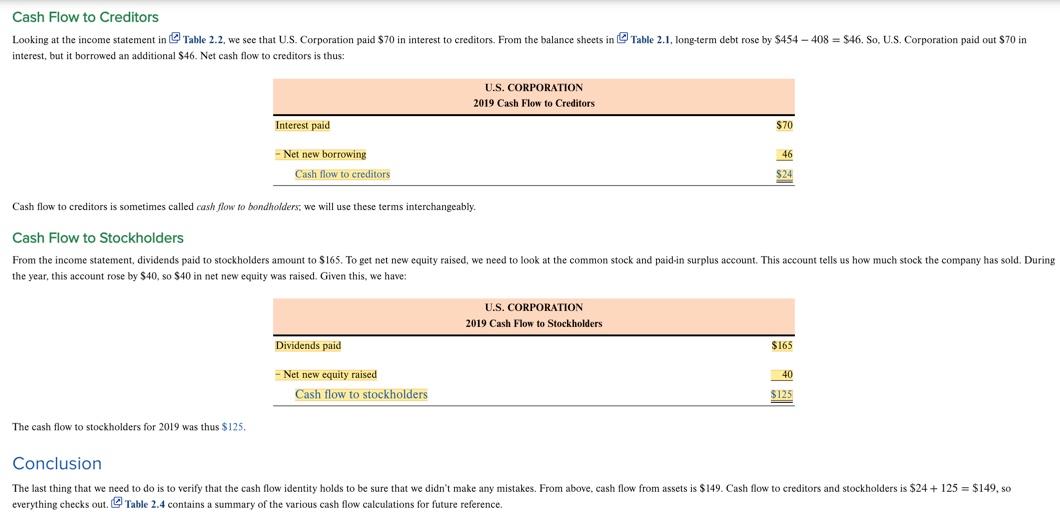
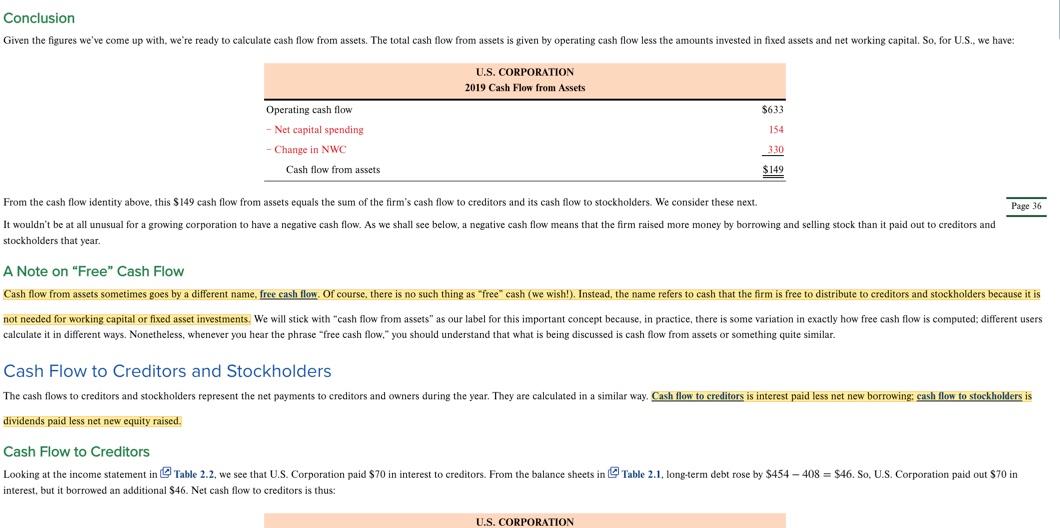
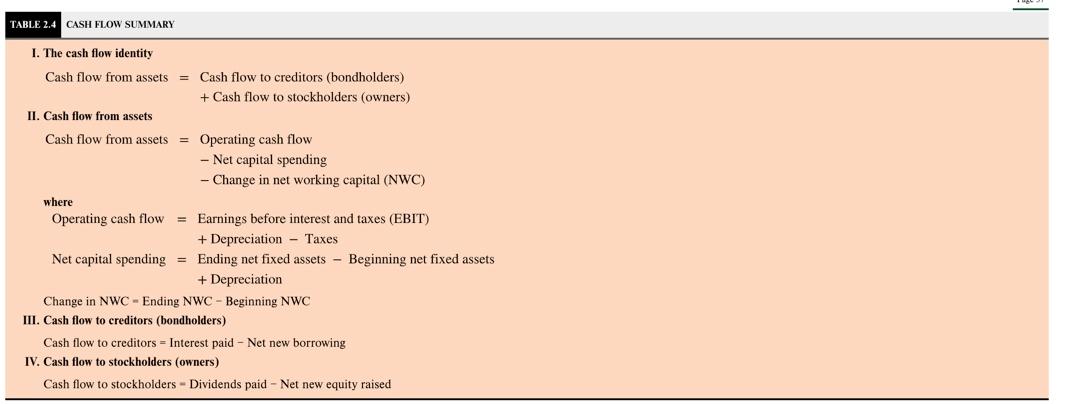
3. Review your company's statement of cash flows for the past two years. Compare the cash flow from operating activities to the income from continuing operations. By how much do they differ, and why do they differ? Has the company needed to raise more capital externally than it returns to its investors? Following the example of Chapter 2, demonstrate how the cash flow from assets equals the cash flows to the creditors and the stockholders. Cash Flow from Assets Cash flow from assets involves three components: operating cash flow, capital spending and change in net working capital. Operating cash flow refers to the cash flow that results from the firm's day-to-day activities of producing and selling. Expenses associated with the firm's financing of its assets are not included because they are not operating expenses. In the normal course of events, some portion of the firm's cash flow is reinvested in the firm. Capital spending refers to the net spending on fixed assets (purchases of fixed assets less sales of fixed assets). Finally, the change in networking capital is the amount spent on net working capital. It is measured as the change in net working capital over the period being examined and represents the net increase or decrease in current assets over current liabilities. The three components of cash flow are examined in more detail next. In all our examples, all amounts are in millions dollars. Operating Cash Flow To calculate operating cash flow (OCF), we want to calculate revenues minus costs, but we don't want to include depreciation because it's not a cash outflow, and we don't want to include interest because it's a financing expense. We do want to include taxes because taxes are, unfortunately, paid in cash If we look at U.S. Corporation's income statement Table 2.2), we see that earnings before interest and taxes (EBIT) are $670. This is almost what we want because it doesn't include interest paid. We need to make two adjustments. First, recall that depreciation is a noncash expense. To get cash flow, we first add back the $89 in depreciation because it wasn't a cash deduction. The other adjustment is to subtract the $126 in taxes because these were paid in cash. The result is operating cash flow: U.S. CORPORATION 2019 Operating Cash Flow $670 Earnings before interest and taxes + Depreciation 89 Taxes 126 Operating cash flow $633 U.S. Corporation thus had a 2019 operating cash flow of $633. Operating cash flow is an important number because it tells us, on a very basic level, whether or not a firm's cash inflows from its business operations are sufficient to cover its everyday cash outflows. For this reason, a negative operating cash flow is often a sign of trouble. There is an unpleasant possibility for confusion when we speak of operating cash flow. In accounting practice, operating cash flow often is defined as net income plus depreciation. For U.S. Corporation, this would amount to $474 + 89 = $563. The accounting definition of operating cash flow differs from ours in one important way: Interest is deducted when net income is computed. Notice that the difference between the $633 operating cash flow we calculated and this $563 is $70. the amount of interest paid for the year. This definition of cash flow thus considers interest paid to be an operating expense. Our definition treats it properly as a financing expense. If there were no interest expense, the two definitions would be the same. Page 35 Capital Spending Net capital spending is money spent on fixed assets less money received from the sale of fixed assets. At the end of 2018. net fixed assets for U.S. Corporation Table 2.1) were $1,644. During the year, we wrote off (depreciated) $89 worth of fixed assets on the income statement. So, if we didn't purchase any new fixed assets, net fixed assets would have been $1.644 - 89 = $1,555 at year's end. The 2019 balance sheet shows $1.709 in net fixed assets, so we must have spent a total of $1.709 - 1,555 = $154 on fixed assets during the year: Ending net fixed assets $1.709 1,644 - Beginning net fixed assets + Depreciation Net investment in fixed assets 89 $ 154 This $154 is our net capital spending for 2019, Could net capital spending be negative? The answer is yes. This would happen if the firm sold off more assets than it purchased. The net here refers to purchases of fixed assets net of any sales of fixed assets. Change in Net Working Capital In addition to investing in fixed assets, a firm also will invest in current assets. For example, going back to the balance sheet in Table 2.1,we see that at the end of 2019, U.S. had current assets of $1,403. At the end of 2018, current assets were $1.112. so, during the year, U.S. invested $1,403 - 1.112 = $291 in current assets. As the firm changes its investment in current assets, its current liabilities usually will change as well. To determine the change in net working capital, the easiest approach is to take the difference between the beginning and ending networking capital (NWC) figures. Net working capital at the end of 2019 was $1,403-389 = $1,014. Similarly, at the end of 2018, net working capital was $1,112 - 428 = $684. So, given these figures, we have $1,014 Ending NWC - Beginning NWC Change in NWC 684 $ 3,30 Net working capital thus increased by $330. Put another way, U.S. Corporation had a net investment of $330 in NWC for the year. Cash Flow to Creditors Looking at the income statement in Table 2.2, we see that U.S. Corporation paid $70 in interest to creditors. From the balance sheets in Table 2.1, long-term debt rose by $454 - 408 = $46. So, U.S. Corporation paid out $70 in interest, but it borrowed an additional $46. Net cash flow to creditors is thus: U.S. CORPORATION 2019 Cash Flow to Creditors Interest paid $70 46 -Net new borrowing Cash flow to creditors $24 Cash flow to creditors is sometimes called cash flow to bondholders, we will use these terms interchangeably Cash Flow to Stockholders From the income statement, dividends paid to stockholders amount to $165. To get net new equity raised, we need to look at the common stock and paid-in surplus account. This account tells the year, this account rose by $40. so $40 in net new equity was raised. Given this, we have: how much stock the company has sold. During U.S. CORPORATION 2019 Cash Flow Stockholders Dividends paid $165 40 -Net new equity raised Cash flow to stockholders $125 The cash flow to stockholders for 2019 was thus $125. Conclusion The last thing that we need to do is to verify that the cash flow identity holds to be sure that we didn't make any mistakes. From above. cash flow from assets is $149. Cash flow to creditors and stockholders is $24 + 125 = $149, so everything checks out. Table 2.4 contains a summary of the various cash flow calculations for future reference. Conclusion Given the figures we've come up with, we're ready to calculate cash flow from assets. The total cash flow from assets is given by operating cash flow less the amounts invested in fixed assets and networking capital. So, for U.S., we have: U.S. CORPORATION 2019 Cash Flow from Assets $633 Operating cash flow Net capital spending 154 Change in NWC 330 Cash flow from assets $149 Page 36 From the cash flow identity above, this $149 cash flow from assets equals the sum of the firm's cash flow to creditors and its cash flow to stockholders. We consider these next. It wouldn't be at all unusual for a growing corporation to have a negative cash flow. As we shall see below, a negative cash flow means that the firm raised more money by borrowing and selling stock than it paid out to creditors and stockholders that year. A Note on "Free" Cash Flow Cash flow from assets sometimes goes by a different name, free cash flow. Of course, there is no such thing as "free" cash (we wish!). Instead, the name refers to cash that the firm is free to distribute to creditors and stockholders because it is not needed for working capital or fixed asset investments. We will stick with "cash flow from assets" as our label for this important concept because, in practice, there is some variation in exactly how free cash flow is computed different users calculate it in different ways. Nonetheless, whenever you hear the phrase "free cash flow," you should understand that what is being discussed is cash flow from assets something quite similar. Cash Flow to Creditors and Stockholders The cash flows to creditors and stockholders represent the net payments to creditors and owners during the year. They are calculated in a similar way. Cash flow to creditors is interest paid less net new borrowing: cash flow to stockholders is dividends paid less net new equity raised. Cash Flow to Creditors Looking at the income statement in Table 2.2, we see that U.S. Corporation paid $70 in interest to creditors. From the balance sheets in Table 2.1, long-term debt rose by $454 - 408 = $46. So, U.S. Corporation paid out $70 in interest, but it borrowed an additional $46. Net cash flow to creditors is thus: U.S. CORPORATION TABLE 2.4 CASH FLOW SUMMARY I. The cash flow identity Cash flow from assets = Cash flow to creditors (bondholders) + Cash flow to stockholders (owners) II. Cash flow from assets Cash flow from assets = Operating cash flow - Net capital spending - Change in net working capital (NWC) where Operating cash flow = Earnings before interest and taxes (EBIT) + Depreciation - Taxes Net capital spending = Ending net fixed assets - Beginning net fixed assets + Depreciation Change in NWC - Ending NWC - Beginning NWC III. Cash flow to creditors (bondholders) Cash flow to creditors - Interest paid - Net new borrowing IV. Cash flow to stockholders (owners) Cash flow to stockholders - Dividends paid - Net new equity raised 3. Review your company's statement of cash flows for the past two years. Compare the cash flow from operating activities to the income from continuing operations. By how much do they differ, and why do they differ? Has the company needed to raise more capital externally than it returns to its investors? Following the example of Chapter 2, demonstrate how the cash flow from assets equals the cash flows to the creditors and the stockholders. Cash Flow from Assets Cash flow from assets involves three components: operating cash flow, capital spending and change in net working capital. Operating cash flow refers to the cash flow that results from the firm's day-to-day activities of producing and selling. Expenses associated with the firm's financing of its assets are not included because they are not operating expenses. In the normal course of events, some portion of the firm's cash flow is reinvested in the firm. Capital spending refers to the net spending on fixed assets (purchases of fixed assets less sales of fixed assets). Finally, the change in networking capital is the amount spent on net working capital. It is measured as the change in net working capital over the period being examined and represents the net increase or decrease in current assets over current liabilities. The three components of cash flow are examined in more detail next. In all our examples, all amounts are in millions dollars. Operating Cash Flow To calculate operating cash flow (OCF), we want to calculate revenues minus costs, but we don't want to include depreciation because it's not a cash outflow, and we don't want to include interest because it's a financing expense. We do want to include taxes because taxes are, unfortunately, paid in cash If we look at U.S. Corporation's income statement Table 2.2), we see that earnings before interest and taxes (EBIT) are $670. This is almost what we want because it doesn't include interest paid. We need to make two adjustments. First, recall that depreciation is a noncash expense. To get cash flow, we first add back the $89 in depreciation because it wasn't a cash deduction. The other adjustment is to subtract the $126 in taxes because these were paid in cash. The result is operating cash flow: U.S. CORPORATION 2019 Operating Cash Flow $670 Earnings before interest and taxes + Depreciation 89 Taxes 126 Operating cash flow $633 U.S. Corporation thus had a 2019 operating cash flow of $633. Operating cash flow is an important number because it tells us, on a very basic level, whether or not a firm's cash inflows from its business operations are sufficient to cover its everyday cash outflows. For this reason, a negative operating cash flow is often a sign of trouble. There is an unpleasant possibility for confusion when we speak of operating cash flow. In accounting practice, operating cash flow often is defined as net income plus depreciation. For U.S. Corporation, this would amount to $474 + 89 = $563. The accounting definition of operating cash flow differs from ours in one important way: Interest is deducted when net income is computed. Notice that the difference between the $633 operating cash flow we calculated and this $563 is $70. the amount of interest paid for the year. This definition of cash flow thus considers interest paid to be an operating expense. Our definition treats it properly as a financing expense. If there were no interest expense, the two definitions would be the same. Page 35 Capital Spending Net capital spending is money spent on fixed assets less money received from the sale of fixed assets. At the end of 2018. net fixed assets for U.S. Corporation Table 2.1) were $1,644. During the year, we wrote off (depreciated) $89 worth of fixed assets on the income statement. So, if we didn't purchase any new fixed assets, net fixed assets would have been $1.644 - 89 = $1,555 at year's end. The 2019 balance sheet shows $1.709 in net fixed assets, so we must have spent a total of $1.709 - 1,555 = $154 on fixed assets during the year: Ending net fixed assets $1.709 1,644 - Beginning net fixed assets + Depreciation Net investment in fixed assets 89 $ 154 This $154 is our net capital spending for 2019, Could net capital spending be negative? The answer is yes. This would happen if the firm sold off more assets than it purchased. The net here refers to purchases of fixed assets net of any sales of fixed assets. Change in Net Working Capital In addition to investing in fixed assets, a firm also will invest in current assets. For example, going back to the balance sheet in Table 2.1,we see that at the end of 2019, U.S. had current assets of $1,403. At the end of 2018, current assets were $1.112. so, during the year, U.S. invested $1,403 - 1.112 = $291 in current assets. As the firm changes its investment in current assets, its current liabilities usually will change as well. To determine the change in net working capital, the easiest approach is to take the difference between the beginning and ending networking capital (NWC) figures. Net working capital at the end of 2019 was $1,403-389 = $1,014. Similarly, at the end of 2018, net working capital was $1,112 - 428 = $684. So, given these figures, we have $1,014 Ending NWC - Beginning NWC Change in NWC 684 $ 3,30 Net working capital thus increased by $330. Put another way, U.S. Corporation had a net investment of $330 in NWC for the year. Cash Flow to Creditors Looking at the income statement in Table 2.2, we see that U.S. Corporation paid $70 in interest to creditors. From the balance sheets in Table 2.1, long-term debt rose by $454 - 408 = $46. So, U.S. Corporation paid out $70 in interest, but it borrowed an additional $46. Net cash flow to creditors is thus: U.S. CORPORATION 2019 Cash Flow to Creditors Interest paid $70 46 -Net new borrowing Cash flow to creditors $24 Cash flow to creditors is sometimes called cash flow to bondholders, we will use these terms interchangeably Cash Flow to Stockholders From the income statement, dividends paid to stockholders amount to $165. To get net new equity raised, we need to look at the common stock and paid-in surplus account. This account tells the year, this account rose by $40. so $40 in net new equity was raised. Given this, we have: how much stock the company has sold. During U.S. CORPORATION 2019 Cash Flow Stockholders Dividends paid $165 40 -Net new equity raised Cash flow to stockholders $125 The cash flow to stockholders for 2019 was thus $125. Conclusion The last thing that we need to do is to verify that the cash flow identity holds to be sure that we didn't make any mistakes. From above. cash flow from assets is $149. Cash flow to creditors and stockholders is $24 + 125 = $149, so everything checks out. Table 2.4 contains a summary of the various cash flow calculations for future reference. Conclusion Given the figures we've come up with, we're ready to calculate cash flow from assets. The total cash flow from assets is given by operating cash flow less the amounts invested in fixed assets and networking capital. So, for U.S., we have: U.S. CORPORATION 2019 Cash Flow from Assets $633 Operating cash flow Net capital spending 154 Change in NWC 330 Cash flow from assets $149 Page 36 From the cash flow identity above, this $149 cash flow from assets equals the sum of the firm's cash flow to creditors and its cash flow to stockholders. We consider these next. It wouldn't be at all unusual for a growing corporation to have a negative cash flow. As we shall see below, a negative cash flow means that the firm raised more money by borrowing and selling stock than it paid out to creditors and stockholders that year. A Note on "Free" Cash Flow Cash flow from assets sometimes goes by a different name, free cash flow. Of course, there is no such thing as "free" cash (we wish!). Instead, the name refers to cash that the firm is free to distribute to creditors and stockholders because it is not needed for working capital or fixed asset investments. We will stick with "cash flow from assets" as our label for this important concept because, in practice, there is some variation in exactly how free cash flow is computed different users calculate it in different ways. Nonetheless, whenever you hear the phrase "free cash flow," you should understand that what is being discussed is cash flow from assets something quite similar. Cash Flow to Creditors and Stockholders The cash flows to creditors and stockholders represent the net payments to creditors and owners during the year. They are calculated in a similar way. Cash flow to creditors is interest paid less net new borrowing: cash flow to stockholders is dividends paid less net new equity raised. Cash Flow to Creditors Looking at the income statement in Table 2.2, we see that U.S. Corporation paid $70 in interest to creditors. From the balance sheets in Table 2.1, long-term debt rose by $454 - 408 = $46. So, U.S. Corporation paid out $70 in interest, but it borrowed an additional $46. Net cash flow to creditors is thus: U.S. CORPORATION TABLE 2.4 CASH FLOW SUMMARY I. The cash flow identity Cash flow from assets = Cash flow to creditors (bondholders) + Cash flow to stockholders (owners) II. Cash flow from assets Cash flow from assets = Operating cash flow - Net capital spending - Change in net working capital (NWC) where Operating cash flow = Earnings before interest and taxes (EBIT) + Depreciation - Taxes Net capital spending = Ending net fixed assets - Beginning net fixed assets + Depreciation Change in NWC - Ending NWC - Beginning NWC III. Cash flow to creditors (bondholders) Cash flow to creditors - Interest paid - Net new borrowing IV. Cash flow to stockholders (owners) Cash flow to stockholders - Dividends paid - Net new equity raised


