

Answered step by step
Verified Expert Solution
Question
1 Approved Answer
This is one of my past paper and I dont know the answers. Appendices I to Ill contain a Balance Sheet and Statement of Income
This is one of my past paper and I dont know the answers. 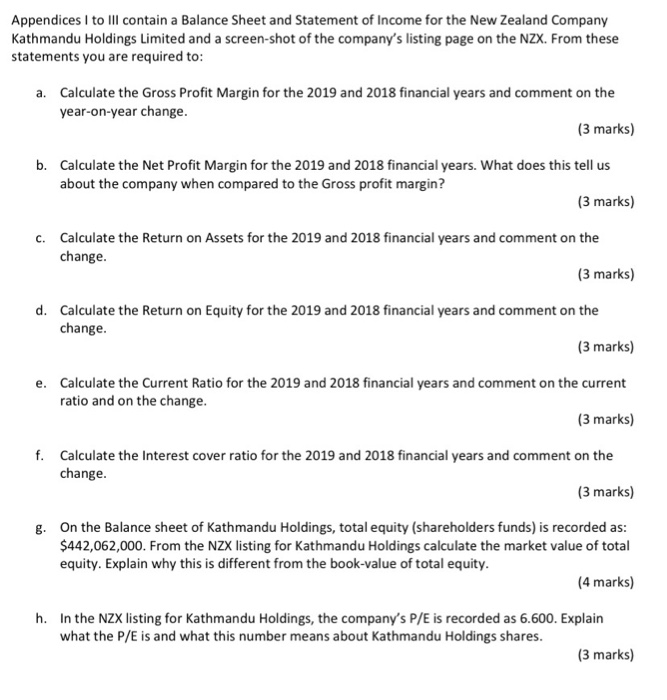
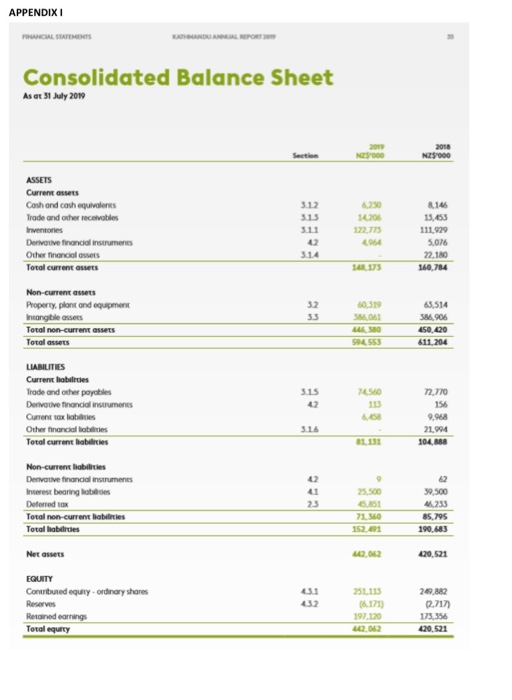
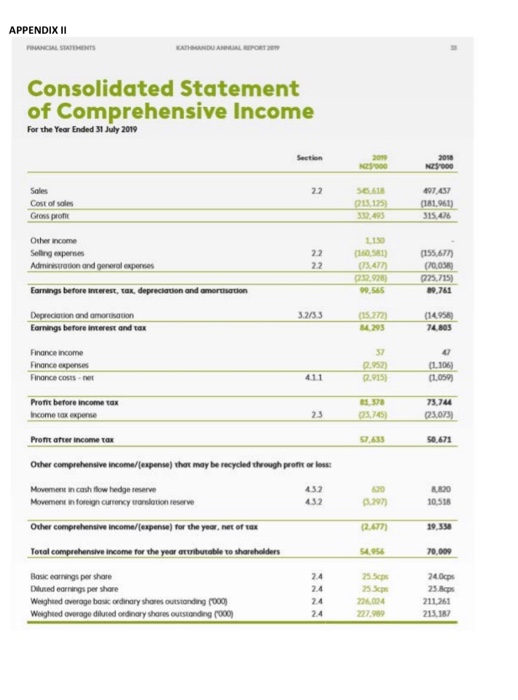
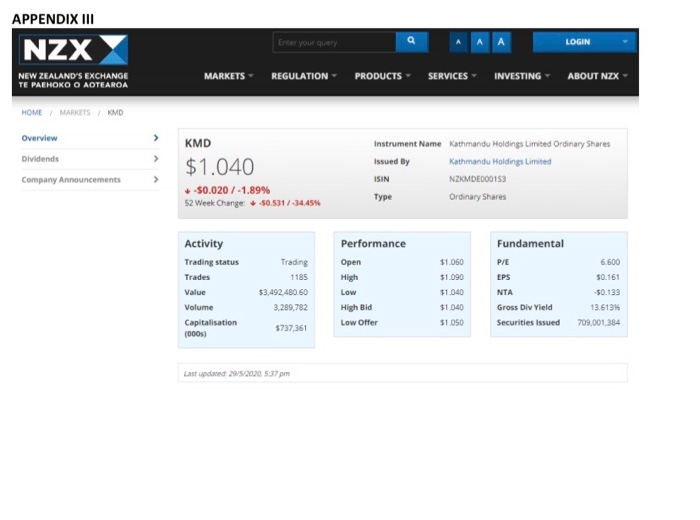
Appendices I to Ill contain a Balance Sheet and Statement of Income for the New Zealand Company Kathmandu Holdings Limited and a screen-shot of the company's listing page on the NZX. From these statements you are required to: a. Calculate the Gross Profit Margin for the 2019 and 2018 financial years and comment on the year-on-year change. (3 marks) b. Calculate the Net Profit Margin for the 2019 and 2018 financial years. What does this tell us about the company when compared to the Gross profit margin? (3 marks) C. Calculate the Return on Assets for the 2019 and 2018 financial years and comment on the change. (3 marks) d. Calculate the Return on Equity for the 2019 and 2018 financial years and comment on the change. (3 marks) e. Calculate the Current Ratio for the 2019 and 2018 financial years and comment on the current ratio and on the change. (3 marks) f. Calculate the Interest cover ratio for the 2019 and 2018 financial years and comment on the change. (3 marks) g. On the Balance sheet of Kathmandu Holdings, total equity (shareholders funds) is recorded as: $442,062,000. From the NZX listing for Kathmandu Holdings calculate the market value of total equity. Explain why this is different from the book-value of total equity. (4 marks) h. In the NZX listing for Kathmandu Holdings, the company's P/E is recorded as 6.600. Explain what the P/E is and what this number means about Kathmandu Holdings shares. (3 marks) APPENDIX I FUNCHAL STATEMENTS KASUNDUAREGAL REPORT Consolidated Balance Sheet As at 31 July 2010 2012 NES000 2018 NZ5000 ASSETS Current assets Cosh and cash equivalents Trade and other receivables Inventories Derivative financial instruments Other financiales Total current assets 3.12 313 3.11 250 14208 122.775 494 8.146 13.63 111.929 5.076 22.180 3.14 SA 175 160,784 Non-current assets Property, plant and equipment Intangible assets Toral non-current assets Total assets 32 3.3 60319 586.061 580 594555 63,514 5906 450.020 611.204 LIABILITIES Current liabilities Trade and other payables Derivative financial instruments Current axlab Other financial labies Total current habilities 3.15 42 7656 113 72.770 156 9,968 21.994 104.888 3.16 u 23 Non-current abilities Derivative financial instruments Interest bearing lobes Deferred Ox Total non-current liabilities Total liabilities Net assets 25.500 6.851 71.560 152.491 59.500 46.233 85,795 190.683 02.062 420,521 431 432 251.115 EQUITY Contributed equity - ordinary shares Reserves Retained earnings Toral equity 249.882 197.120 12.062 22,717) 173,356 420,521 APPENDIX II PANCALATOS KATAUHU ABBRAL REPORT 20 Consolidated Statement of Comprehensive Income For the Year Ended 31 July 2010 Section 209 NE000 2010 NES000 22 Sales Cost of sales Gross profit 56.618 21.125 497.457 (181961) 315.476 Other income Selling experies Administration and general expenses Earnings before Interest, tax, depreciation and amortisation 22 22 1150 (160581) 73.4 122.928) 99.565 (155.677 (70.00 0225,715) 89,761 3.2/3.3 Depreciation and amorisation Eomings before interest and tax (15.2723 203 (14.954) 74.805 Finance income Finance expenses Finance COSTS-net 57 12.952) 2,9153 (1.105) (1.059) 411 61.370 Pront before income tax Income tax expense 23 73.744 (23.073 50.671 Premit after income tax Other comprehensive Income/(expense) that may be recycled through profit or less: Movement in cash flow hedge reserve Movement in foreign currency anotion reserve 432 432 620 297 8.820 10,518 (2.677 5456 70,000 Other comprehensive Income//expense) for the year, net of tax Total comprehensive Income for the year ateributable to shareholders Basic earrings per share Diluted earrings per share Weighted average bosc ordinary shores outstanding (000) Weighted average diluted ordinary shares outstanding (000) 24 24 24 24 25.5 255 226094 24.00 23.eps 211.261 213.187 Enter your query LOGIN APPENDIX III NZX NEW ZEALAND'S EXCHANGE TE PAEHOKO O AOTEAROA MARKETS REGULATION PRODUCTS SERVICES INVESTING ABOUT NZX HOME MARKETS KMD Overview Dividends Company Announcements KMD $1.040 -50.020 / -1,89% 52 Week Change: 50.531/-34454 Instrument Name Kathmandu Holdings Limited Ordinary Shares Issued By Kathmandu Holdings Limited ISIN NZKMDE000153 Type Ordinary Shares > Activity Trading status Trades Value Volume Capitalisation 1000) Trading 1185 $3,492.480.60 3.289,782 Performance Open High Low High Bid Low Offer $1.060 $1.090 $1.040 $1.040 $1.050 Fundamental P/E EPS NTA Gross Div Yield Securities issued 6,600 $0.161 -$0.133 13.613% 709,001,384 5737,361 Last updated 2952030 5:37 pm Step by Step Solution
There are 3 Steps involved in it
Step: 1

Get Instant Access to Expert-Tailored Solutions
See step-by-step solutions with expert insights and AI powered tools for academic success
Step: 2

Step: 3
Ace Your Homework with AI
Get the answers you need in no time with our AI-driven, step-by-step assistance
Get Started
Whispers In The Auditing Room
Authors: Azhar UL Haque
1st Edition
B0C63ZTK27, 979-8223789352