

Question
This is only one problem there is 6 part of this questions: PLEASE EXPLAIN EACH OF THEM ALSO PLEASE EXPLAIN IN EXCEL AND PLEASE UPLOAD
This is only one problem there is 6 part of this questions:
PLEASE EXPLAIN EACH OF THEM ALSO PLEASE EXPLAIN IN EXCEL AND PLEASE UPLOAD ANSWERS IN EXCEL FILE AND WHICH METHOD YOU HAVE USED :
ALSO I HAVE INCLUDED 4 FILES - THE SCREENSHOTS THE INFORMATION TO CALCULATE
1.) Dupont analysis: five-way decomposition
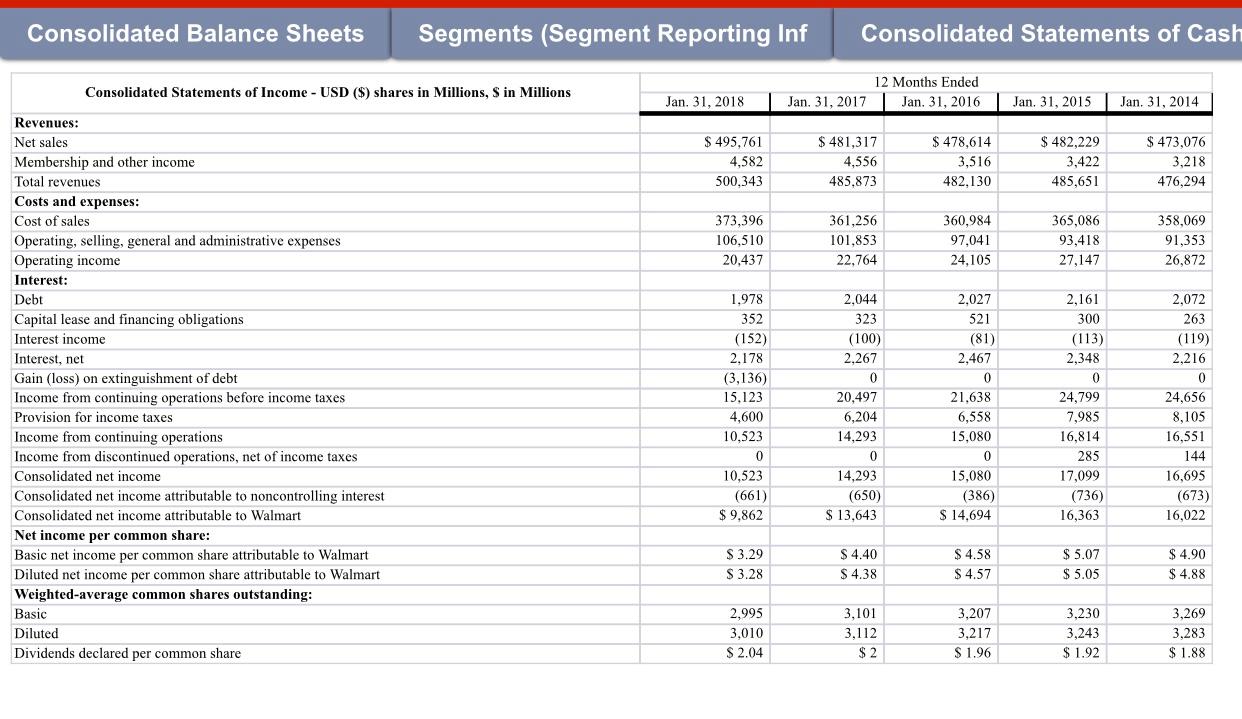
Calculate Return on equity (ROE) first. Then use five-way DuPont analysis to isolate the components affecting the ROA and identify the drivers of Walmart's performance. Have you found any potential operational flaws or any unidentified opportunities?
2.) An analysis of the composition of the asset base;
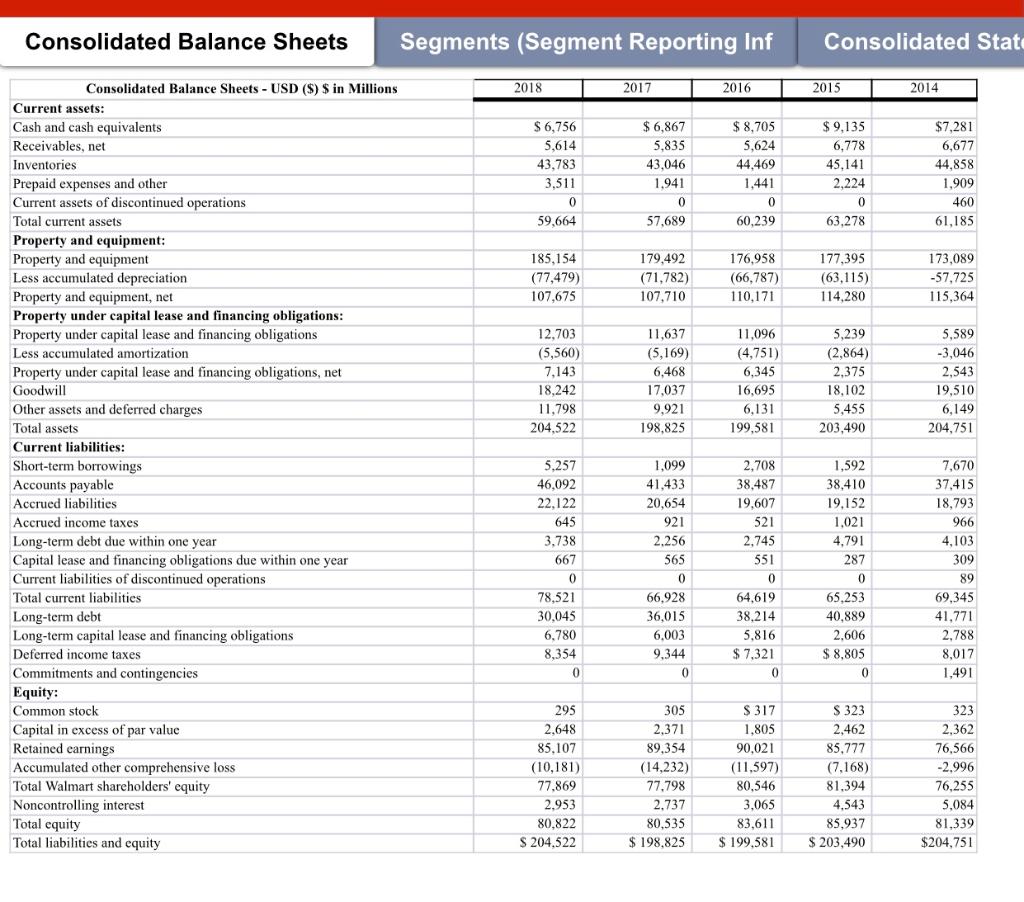
Construct a common-size balance sheet, focus on the major components of current assets and long-term assets. Have you noticed any significant changes from a trend analysis? Put numbers and trends into perspective. explain in that manner.
3.) An analysis of the capital structure;
Have you noticed any significant changes from the trend analysis of long-term debts and short-term debts here ?
How does that relate to the result of your trend analysis of leverage ratios please explain?
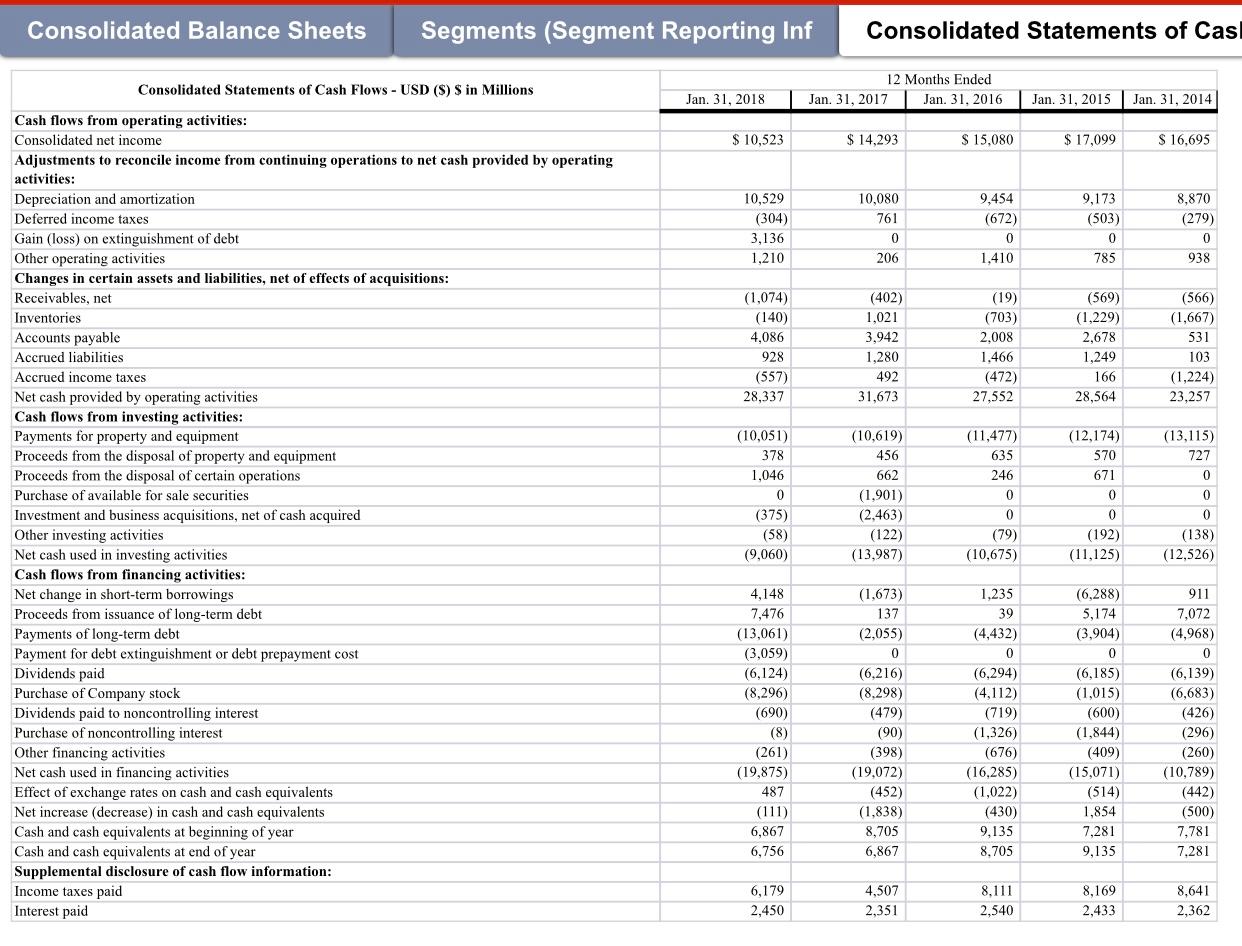
Calculate current ratios, quick ratios, days sales outstanding, days on hand of inventory, number of days payables, and cash conversion cycle. Comment on the results of the trend analysis of those efficiency ratios. Stick with the formula used in the textbooks and slides.
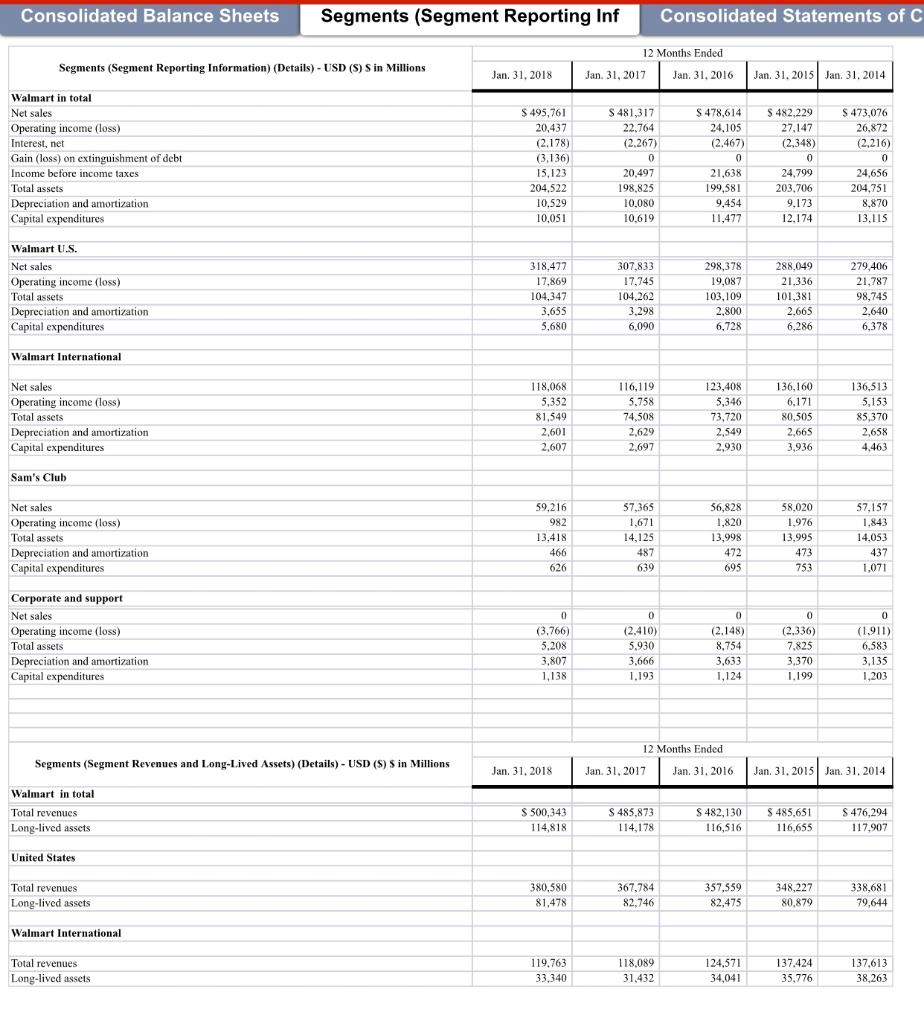
4.) Segments and the allocation of capital among them; Data of segments are in the sheets of the data file (Excel).
Based on the disclosed information of reportable segments of Walmart,
conduct a trend analysis and comment on the performance metrics of the segments.
1. Calculate operating income margin (OI margin) for each segment as operating income/total sales.
2. Calculate the ratio of proportion of capital expenditure(CE) to proportion of total assets(TA) for each segment: Divide segmental CE to total CE(proportion of capital expenditure), divide segmental TA to total TA(proportion of total assets), and
divide the above two to get the ratio of proportion of capital expenditure to proportion of total assets. Examine this final product from the above three steps carefully: does higher capital investment bring higher profitability? Did Walmart invest its capital in the more profitable segment (investment efficiency)? If not, any policy recommendation?
5.) Accruals in reporting: calculate balance sheet accruals and statement of cash flows accruals. Any concern of earnings quality measured by those accruals from the trend analysis?
6.) Earnings quality assessment (Beineish Score). Based on the calculations, do you have any concern over Walmart's earnings quality?
Note: use net A/R and net PPE from the balance sheet, and depreciation/amortization from the cash flow statement as depreciation expense to calculate Beineish Score. Examine account titles to infer the amount of debts.
Consolidated Balance Sheets Segments (Segment Reporting Inf Consolidated Statements of Cash Consolidated Statements of Income - USD ($) shares in Millions, S in Millions 12 Months Ended Jan. 31, 2016 Jan. 31, 2018 Jan. 31, 2017 Jan. 31, 2015 Jan. 31, 2014 $ 478,614 $ 495,761 4,582 500,343 $ 481,317 4,556 485.873 3,516 $ 482,229 3,422 485,651 $ 473,076 3,218 476,294 482,130 373,396 106,510 20.437 361,256 101,853 22.764 360,984 97,041 24.105 365,086 93,418 27,147 358,069 91,353 26,872 Revenues: Net sales Membership and other income Total revenues Costs and expenses: Cost of sales Operating, selling, general and administrative expenses Operating income Interest: Debt Capital lease and financing obligations Interest income Interest, net Gain (loss) on extinguishment of debt Income from continuing operations before income taxes Provision for income taxes Income from continuing operations Income from discontinued operations, net of income taxes Consolidated net income Consolidated net income attributable to noncontrolling interest Consolidated net income attributable to Walmart Net income per common share: Basic net income per common share attributable to Walmart Diluted net income per common share attributable to Walmart Weighted average common shares outstanding: Basic Diluted Dividends declared per common share 1,978 352 (152) 2,178 (3,136) 15,123 2,044 323 (100) 2,267 0 20,497 6,204 14,293 0 14,293 (650) $ 13,643 2.027 521 (81) 2,467 0 21,638 6,558 15.080 0 15.080 (386) $ 14,694 2,161 300 (113) 2,348 0 24,799 7,985 16,814 285 17,099 (736) 16,363 2,072 263 (119) 2,216 0 24,656 8,105 16,551 144 16,695 (673) 16,022 4,600 10,523 0 10,523 (661) $ 9,862 $ 3.29 $ 3.28 $ 4.40 $ 4.38 $ 4.58 $ 4.57 $ 5.07 $ 5.05 $ 4.90 $ 4.88 2,995 3,010 $ 2.04 3,101 3,112 $ 2 3,207 3,217 $ 1.96 3,230 3,243 $ 1.92 3,269 3,283 $ 1.88 Consolidated Balance Sheets Segments (Segment Reporting Inf Consolidated Statements of Casi Consolidated Statements of Cash Flows - USD (S) S in Millions 12 Months Ended Jan. 31, 2017 Jan. 31. 2016 Jan. 31, 2018 Jan. 31, 2015 Jan. 31, 2014 $ 10,523 $ 14,293 S 15.080 $ 17,099 $ 16,695 10,529 (304) 3,136 1,210 10,080 761 0 206 9,454 (672) 0 1,410 9,173 (503) 0 785 8,870 (279) 0 938 (1,074) (140) 4.086 928 (557) 28,337 (402) 1,021 3,942 1,280 492 31,673 (19) (703) 2.008 1,466 (472) 27,552 (569) (1,229) 2,678 1,249 166 28,564 (566) (1,667) 531 103 (1,224) 23,257 (12,174) 570 671 (13,115) 727 (11,477) 635 246 0 0 (10,051) 378 1,046 0 (375) (58) (9,060) (10,619) 456 662 (1,901) (2,463) (122) (13,987) Cash flows from operating activities: Consolidated net income Adjustments to reconcile income from continuing operations to net cash provided by operating activities: Depreciation and amortization Deferred income taxes Gain (loss) on extinguishment of debt Other operating activities Changes in certain assets and liabilities, net of effects of acquisitions: Receivables, net Inventories Accounts payable Accrued liabilities Accrued income taxes Net cash provided by operating activities Cash flows from investing activities: Payments for property and equipment Proceeds from the disposal of property and equipment Proceeds from the disposal of certain operations Purchase of available for sale securities Investment and business acquisitions, net of cash acquired Other investing activities Net cash used in investing activities Cash flows from financing activities: Net change in short-term borrowings Proceeds from issuance of long-term debt Payments of long-term debt Payment for debt extinguishment or debt prepayment cost Dividends paid Purchase of Company stock Dividends paid to noncontrolling interest Purchase of noncontrolling interest Other financing activities Net cash used in financing activities Effect of exchange rates on cash and cash equivalents Net increase (decrease) in cash and cash equivalents Cash and cash equivalents at beginning of year Cash and cash equivalents at end of year Supplemental disclosure of cash flow information: Income taxes paid Interest paid 0 0 0 0 (79) (10,675) 0 (192) (11,125) (138) (12,526) 4,148 7,476 (13,061) (3,059) (6,124) (8,296) (690) (8) (261) (19,875) 487 (111) 6,867 6,756 (1,673) 137 (2,055) 0 (6,216) (8.298) (479) (90) (398) (19,072) (452) (1,838) 8,705 6,867 1.235 39 (4,432) 0 (6,294) (4,112) (719) (1,326) (676) (16,285) (1,022) (430) 9,135 8,705 (6,288) 5,174 (3,904) 0 (6,185) (1,015) (600) (1,844) (409) (15,071) (514) 1,854 7,281 9,135 911 7,072 (4,968) 0 (6,139) (6,683) (426) (296) (260) (10,789) (442) (500) 7,781 7.281 6,179 2,450 4,507 2,351 8,111 2,540 8,169 2,433 8,641 2,362 Consolidated Balance Sheets Segments (Segment Reporting Inf Consolidated Statements of C 12 Months Ended Segments (Segment Reporting Information) (Details) - USD (S) S in Millions Jan. 31, 2018 Jan. 31, 2017 Jan. 31, 2016 Jan. 31, 2015 Jan. 31, 2014 Walmart in total Net sales Operating income (loss) Interest, net Gain (loss) on extinguishment of debt Income before income taxes Total assets Depreciation and amortization Capital expenditures $ 495,761 20,437 (2.178) (3.136) 15,123 204,522 10,529 10,051 S481,317 22.764 (2.267) 0 20,497 198,825 10,080 10,619 $ 478,614 24,105 (2.467) 0 21,638 199,581 9,454 11,477 $ 482.229 27,147 (2,348) 0 24,799 203,706 9,173 12.174 $ 473,076 26,872 (2,216) 0 24,656 204,751 8.870 13.115 Walmart U.S. Net sales Operating income (loss) Total assets Depreciation and amortization Capital expenditures 318,477 17,869 104,347 3.655 5.680 307.833 17,745 104.262 3.298 6.090 298,378 19,087 103,109 2,800 6,728 288.049 21.336 101,381 2,665 6.286 279,406 21,787 98,745 2,640 6,378 Walmart International 116,119 5,758 Net sales Operating income (loss) Total assets Depreciation and amortization Capital expenditures 118,068 5,352 81,549 2,601 2,607 74,508 2,629 2,697 123,408 5,346 73,720 2,549 2,930 136,160 6,171 80,505 2,665 3.936 136,513 5,153 85,370 2,658 4,463 Sam's Club Net sales Operating income (loss) Total assets Depreciation and amortization Capital expenditures 59,216 982 13,418 466 626 57,365 1,671 14,125 487 639 56,828 1,820 13,998 472 695 58.020 1,976 13,995 473 753 57,157 1.843 14.053 437 1.071 Corporate and support Net sales Operating income (loss) Total assets Depreciation and amortization Capital expenditures 0 (3,766) 5,208 3.807 1,138 0 (2.410) 5,930 3,666 1.193 0 (2.148) 8,754 3,633 1,124 0 (2.336) 7.825 3,370 1.199 0 (1.911) 6,583 3,135 1,203 12 Months Ended Segments (Segment Revenues and Long-Lived Assets) (Details) - USD ($) Sin Millions Jan. 31. 2018 Jan 31, 2017 Jan 31, 2016 Jan. 31, 2015 Jan 31, 2014 Walmart in total Total revenues Long-lived assets S 500,343 114,818 S 485,873 114,178 S 482,130 116,516 $ 485,651 116,655 S 476,294 117.907 United States Total revenues Long-lived assets 380,580 81,478 367,784 82.746 357.559 82,475 348,227 80,879 338,681 79,644 Walmart International Total revenues Long-lived assets 119.763 33,340 118,089 31,432 124,571 34.041 137.424 35,776 137,613 38,263 Consolidated Balance Sheets Segments (Segment Reporting Inf Consolidated Stat 2018 2017 2016 2015 2014 $ 6,756 5,614 43,783 3.511 0 59,664 $ 6,867 5,835 43,046 1.941 0 57,689 $8,705 5,624 44,469 1,441 0 60,239 $ 9.135 6,778 45.141 2.224 0 63,278 $7,281 6,677 44,858 1,909 460 61,185 185,154 (77,479) 107,675 179,492 (71,782) 107,710 176,958 (66,787) 110,171 177,395 (63,115) 114,280 173,089 -57.725 115,364 12,703 (5,560) 7.143 18,242 11,798 204.522 11,637 (5,169) 6,468 17.037 11,096 (4,751) 6,345 16,695 6,131 199,581 5,239 (2,864) 2,375 18,102 5,455 203,490 5,589 -3,046 2,543 19,510 6,149 204,751 9,921 198,825 Consolidated Balance Sheets - USD ($) $ in Millions Current assets: Cash and cash equivalents Receivables, net Inventories Prepaid expenses and other Current assets of discontinued operations Total current assets Property and equipment: Property and equipment Less accumulated depreciation Property and equipment, net Property under capital lease and financing obligations: Property under capital lease and financing obligations Less accumulated amortization Property under capital lease and financing obligations, net Goodwill Other assets and deferred charges Total assets Current liabilities: Short-term borrowings Accounts payable Accrued liabilities Accrued income taxes Long-term debt due within one year Capital lease and financing obligations due within one year Current liabilities of discontinued operations Total current liabilities Long-term debt Long-term capital lease and financing obligations Deferred income taxes Commitments and contingencies Equity: Common stock Capital in excess of par value Retained earnings Accumulated other comprehensive loss Total Walmart shareholders' equity Noncontrolling interest Total equity Total liabilities and equity 5.257 46,092 22.122 645 3.738 667 1.099 41,433 20,654 921 2.256 565 0 66,928 36,015 6,003 9,344 0 2,708 38,487 19,607 521 2.745 551 0 64.619 38,214 5,816 $ 7,321 0 1,592 38,410 19,152 1.021 4,791 287 0 65.253 40,889 2.606 $ 8,805 0 7,670 37.415 18,793 966 4,103 309 89 69.345 41.771 2.788 8,017 1,491 0 78,521 30.045 6,780 8,354 0 295 2,648 85.107 (10,181) 77.869 2.953 80,822 S 204.522 305 2,371 89,354 (14,232) 77,798 2.737 80,535 $ 198,825 S 317 1.805 90,021 (11.597) 80,546 3,065 83,611 $ 199,581 S 323 2,462 85,777 (7.168) 81,394 4,543 85,937 $ 203,490 323 2.362 76,566 -2.996 76,255 5,084 81,339 $204,751 Consolidated Balance Sheets Segments (Segment Reporting Inf Consolidated Statements of Cash Consolidated Statements of Income - USD ($) shares in Millions, S in Millions 12 Months Ended Jan. 31, 2016 Jan. 31, 2018 Jan. 31, 2017 Jan. 31, 2015 Jan. 31, 2014 $ 478,614 $ 495,761 4,582 500,343 $ 481,317 4,556 485.873 3,516 $ 482,229 3,422 485,651 $ 473,076 3,218 476,294 482,130 373,396 106,510 20.437 361,256 101,853 22.764 360,984 97,041 24.105 365,086 93,418 27,147 358,069 91,353 26,872 Revenues: Net sales Membership and other income Total revenues Costs and expenses: Cost of sales Operating, selling, general and administrative expenses Operating income Interest: Debt Capital lease and financing obligations Interest income Interest, net Gain (loss) on extinguishment of debt Income from continuing operations before income taxes Provision for income taxes Income from continuing operations Income from discontinued operations, net of income taxes Consolidated net income Consolidated net income attributable to noncontrolling interest Consolidated net income attributable to Walmart Net income per common share: Basic net income per common share attributable to Walmart Diluted net income per common share attributable to Walmart Weighted average common shares outstanding: Basic Diluted Dividends declared per common share 1,978 352 (152) 2,178 (3,136) 15,123 2,044 323 (100) 2,267 0 20,497 6,204 14,293 0 14,293 (650) $ 13,643 2.027 521 (81) 2,467 0 21,638 6,558 15.080 0 15.080 (386) $ 14,694 2,161 300 (113) 2,348 0 24,799 7,985 16,814 285 17,099 (736) 16,363 2,072 263 (119) 2,216 0 24,656 8,105 16,551 144 16,695 (673) 16,022 4,600 10,523 0 10,523 (661) $ 9,862 $ 3.29 $ 3.28 $ 4.40 $ 4.38 $ 4.58 $ 4.57 $ 5.07 $ 5.05 $ 4.90 $ 4.88 2,995 3,010 $ 2.04 3,101 3,112 $ 2 3,207 3,217 $ 1.96 3,230 3,243 $ 1.92 3,269 3,283 $ 1.88 Consolidated Balance Sheets Segments (Segment Reporting Inf Consolidated Statements of Casi Consolidated Statements of Cash Flows - USD (S) S in Millions 12 Months Ended Jan. 31, 2017 Jan. 31. 2016 Jan. 31, 2018 Jan. 31, 2015 Jan. 31, 2014 $ 10,523 $ 14,293 S 15.080 $ 17,099 $ 16,695 10,529 (304) 3,136 1,210 10,080 761 0 206 9,454 (672) 0 1,410 9,173 (503) 0 785 8,870 (279) 0 938 (1,074) (140) 4.086 928 (557) 28,337 (402) 1,021 3,942 1,280 492 31,673 (19) (703) 2.008 1,466 (472) 27,552 (569) (1,229) 2,678 1,249 166 28,564 (566) (1,667) 531 103 (1,224) 23,257 (12,174) 570 671 (13,115) 727 (11,477) 635 246 0 0 (10,051) 378 1,046 0 (375) (58) (9,060) (10,619) 456 662 (1,901) (2,463) (122) (13,987) Cash flows from operating activities: Consolidated net income Adjustments to reconcile income from continuing operations to net cash provided by operating activities: Depreciation and amortization Deferred income taxes Gain (loss) on extinguishment of debt Other operating activities Changes in certain assets and liabilities, net of effects of acquisitions: Receivables, net Inventories Accounts payable Accrued liabilities Accrued income taxes Net cash provided by operating activities Cash flows from investing activities: Payments for property and equipment Proceeds from the disposal of property and equipment Proceeds from the disposal of certain operations Purchase of available for sale securities Investment and business acquisitions, net of cash acquired Other investing activities Net cash used in investing activities Cash flows from financing activities: Net change in short-term borrowings Proceeds from issuance of long-term debt Payments of long-term debt Payment for debt extinguishment or debt prepayment cost Dividends paid Purchase of Company stock Dividends paid to noncontrolling interest Purchase of noncontrolling interest Other financing activities Net cash used in financing activities Effect of exchange rates on cash and cash equivalents Net increase (decrease) in cash and cash equivalents Cash and cash equivalents at beginning of year Cash and cash equivalents at end of year Supplemental disclosure of cash flow information: Income taxes paid Interest paid 0 0 0 0 (79) (10,675) 0 (192) (11,125) (138) (12,526) 4,148 7,476 (13,061) (3,059) (6,124) (8,296) (690) (8) (261) (19,875) 487 (111) 6,867 6,756 (1,673) 137 (2,055) 0 (6,216) (8.298) (479) (90) (398) (19,072) (452) (1,838) 8,705 6,867 1.235 39 (4,432) 0 (6,294) (4,112) (719) (1,326) (676) (16,285) (1,022) (430) 9,135 8,705 (6,288) 5,174 (3,904) 0 (6,185) (1,015) (600) (1,844) (409) (15,071) (514) 1,854 7,281 9,135 911 7,072 (4,968) 0 (6,139) (6,683) (426) (296) (260) (10,789) (442) (500) 7,781 7.281 6,179 2,450 4,507 2,351 8,111 2,540 8,169 2,433 8,641 2,362 Consolidated Balance Sheets Segments (Segment Reporting Inf Consolidated Statements of C 12 Months Ended Segments (Segment Reporting Information) (Details) - USD (S) S in Millions Jan. 31, 2018 Jan. 31, 2017 Jan. 31, 2016 Jan. 31, 2015 Jan. 31, 2014 Walmart in total Net sales Operating income (loss) Interest, net Gain (loss) on extinguishment of debt Income before income taxes Total assets Depreciation and amortization Capital expenditures $ 495,761 20,437 (2.178) (3.136) 15,123 204,522 10,529 10,051 S481,317 22.764 (2.267) 0 20,497 198,825 10,080 10,619 $ 478,614 24,105 (2.467) 0 21,638 199,581 9,454 11,477 $ 482.229 27,147 (2,348) 0 24,799 203,706 9,173 12.174 $ 473,076 26,872 (2,216) 0 24,656 204,751 8.870 13.115 Walmart U.S. Net sales Operating income (loss) Total assets Depreciation and amortization Capital expenditures 318,477 17,869 104,347 3.655 5.680 307.833 17,745 104.262 3.298 6.090 298,378 19,087 103,109 2,800 6,728 288.049 21.336 101,381 2,665 6.286 279,406 21,787 98,745 2,640 6,378 Walmart International 116,119 5,758 Net sales Operating income (loss) Total assets Depreciation and amortization Capital expenditures 118,068 5,352 81,549 2,601 2,607 74,508 2,629 2,697 123,408 5,346 73,720 2,549 2,930 136,160 6,171 80,505 2,665 3.936 136,513 5,153 85,370 2,658 4,463 Sam's Club Net sales Operating income (loss) Total assets Depreciation and amortization Capital expenditures 59,216 982 13,418 466 626 57,365 1,671 14,125 487 639 56,828 1,820 13,998 472 695 58.020 1,976 13,995 473 753 57,157 1.843 14.053 437 1.071 Corporate and support Net sales Operating income (loss) Total assets Depreciation and amortization Capital expenditures 0 (3,766) 5,208 3.807 1,138 0 (2.410) 5,930 3,666 1.193 0 (2.148) 8,754 3,633 1,124 0 (2.336) 7.825 3,370 1.199 0 (1.911) 6,583 3,135 1,203 12 Months Ended Segments (Segment Revenues and Long-Lived Assets) (Details) - USD ($) Sin Millions Jan. 31. 2018 Jan 31, 2017 Jan 31, 2016 Jan. 31, 2015 Jan 31, 2014 Walmart in total Total revenues Long-lived assets S 500,343 114,818 S 485,873 114,178 S 482,130 116,516 $ 485,651 116,655 S 476,294 117.907 United States Total revenues Long-lived assets 380,580 81,478 367,784 82.746 357.559 82,475 348,227 80,879 338,681 79,644 Walmart International Total revenues Long-lived assets 119.763 33,340 118,089 31,432 124,571 34.041 137.424 35,776 137,613 38,263 Consolidated Balance Sheets Segments (Segment Reporting Inf Consolidated Stat 2018 2017 2016 2015 2014 $ 6,756 5,614 43,783 3.511 0 59,664 $ 6,867 5,835 43,046 1.941 0 57,689 $8,705 5,624 44,469 1,441 0 60,239 $ 9.135 6,778 45.141 2.224 0 63,278 $7,281 6,677 44,858 1,909 460 61,185 185,154 (77,479) 107,675 179,492 (71,782) 107,710 176,958 (66,787) 110,171 177,395 (63,115) 114,280 173,089 -57.725 115,364 12,703 (5,560) 7.143 18,242 11,798 204.522 11,637 (5,169) 6,468 17.037 11,096 (4,751) 6,345 16,695 6,131 199,581 5,239 (2,864) 2,375 18,102 5,455 203,490 5,589 -3,046 2,543 19,510 6,149 204,751 9,921 198,825 Consolidated Balance Sheets - USD ($) $ in Millions Current assets: Cash and cash equivalents Receivables, net Inventories Prepaid expenses and other Current assets of discontinued operations Total current assets Property and equipment: Property and equipment Less accumulated depreciation Property and equipment, net Property under capital lease and financing obligations: Property under capital lease and financing obligations Less accumulated amortization Property under capital lease and financing obligations, net Goodwill Other assets and deferred charges Total assets Current liabilities: Short-term borrowings Accounts payable Accrued liabilities Accrued income taxes Long-term debt due within one year Capital lease and financing obligations due within one year Current liabilities of discontinued operations Total current liabilities Long-term debt Long-term capital lease and financing obligations Deferred income taxes Commitments and contingencies Equity: Common stock Capital in excess of par value Retained earnings Accumulated other comprehensive loss Total Walmart shareholders' equity Noncontrolling interest Total equity Total liabilities and equity 5.257 46,092 22.122 645 3.738 667 1.099 41,433 20,654 921 2.256 565 0 66,928 36,015 6,003 9,344 0 2,708 38,487 19,607 521 2.745 551 0 64.619 38,214 5,816 $ 7,321 0 1,592 38,410 19,152 1.021 4,791 287 0 65.253 40,889 2.606 $ 8,805 0 7,670 37.415 18,793 966 4,103 309 89 69.345 41.771 2.788 8,017 1,491 0 78,521 30.045 6,780 8,354 0 295 2,648 85.107 (10,181) 77.869 2.953 80,822 S 204.522 305 2,371 89,354 (14,232) 77,798 2.737 80,535 $ 198,825 S 317 1.805 90,021 (11.597) 80,546 3,065 83,611 $ 199,581 S 323 2,462 85,777 (7.168) 81,394 4,543 85,937 $ 203,490 323 2.362 76,566 -2.996 76,255 5,084 81,339 $204,751Step by Step Solution
There are 3 Steps involved in it
Step: 1

Get Instant Access to Expert-Tailored Solutions
See step-by-step solutions with expert insights and AI powered tools for academic success
Step: 2

Step: 3
Ace Your Homework with AI
Get the answers you need in no time with our AI-driven, step-by-step assistance
Get Started
Financial Accounting The Impact On Decision Makers
Authors: Gary A Porter, Curtis L Norton
7th Edition
1439080526, 9781439080528