This is statistics course and I need help with answering those questions. If you don't have much time to provide solutions, that's fine but I need correct answers asap. Thank you
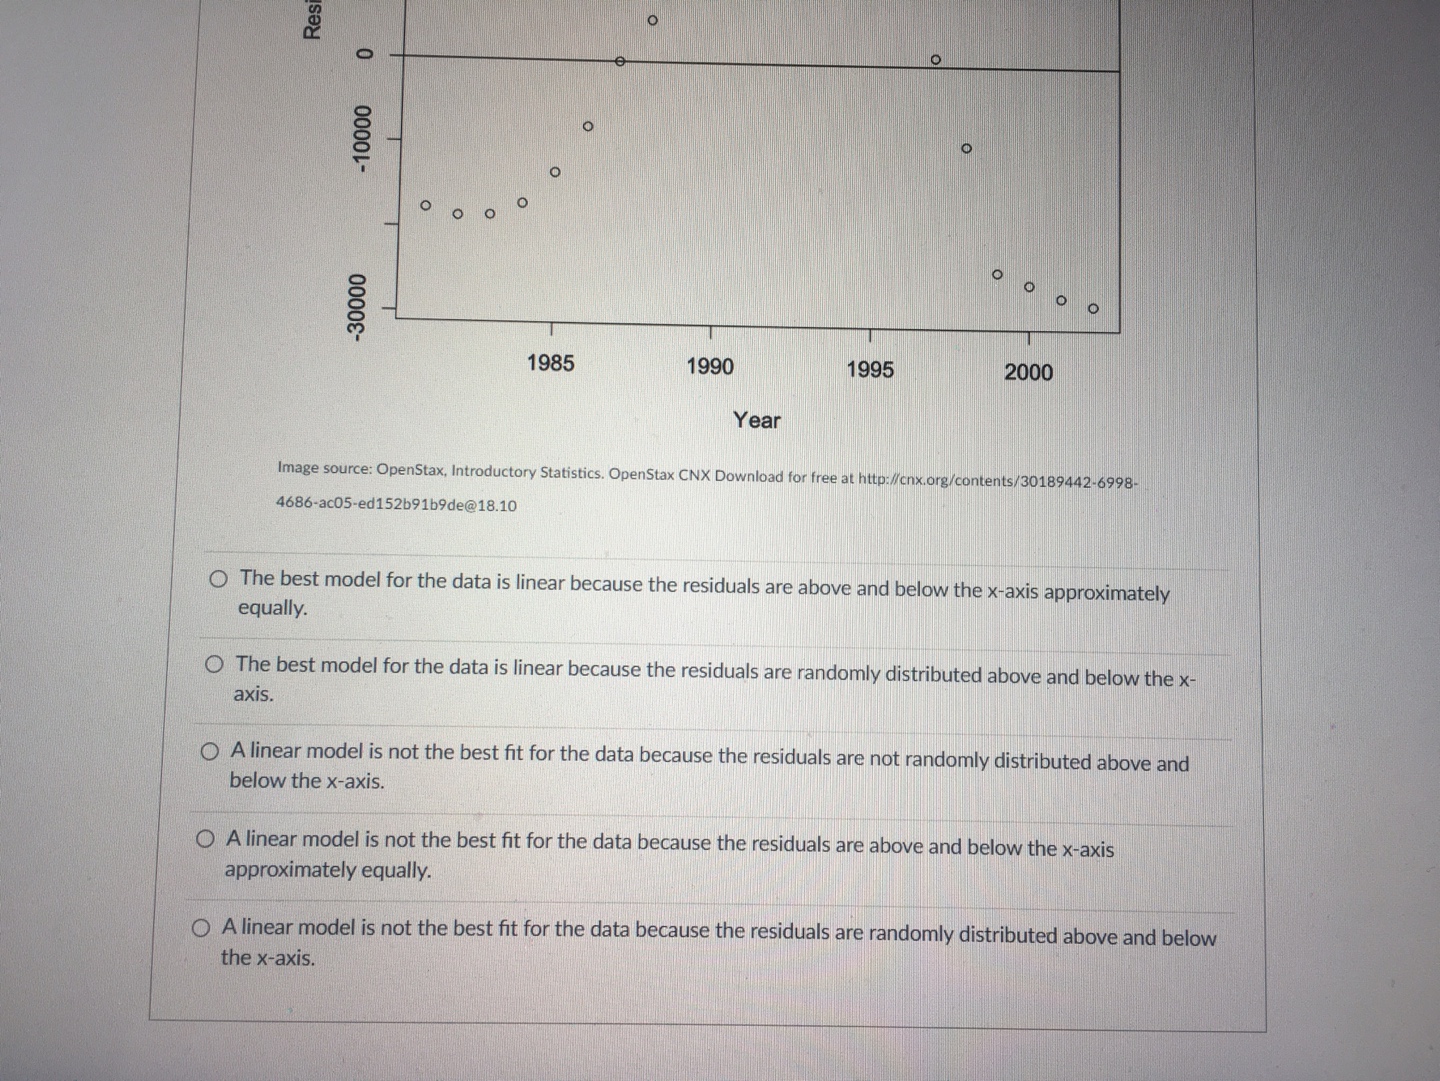
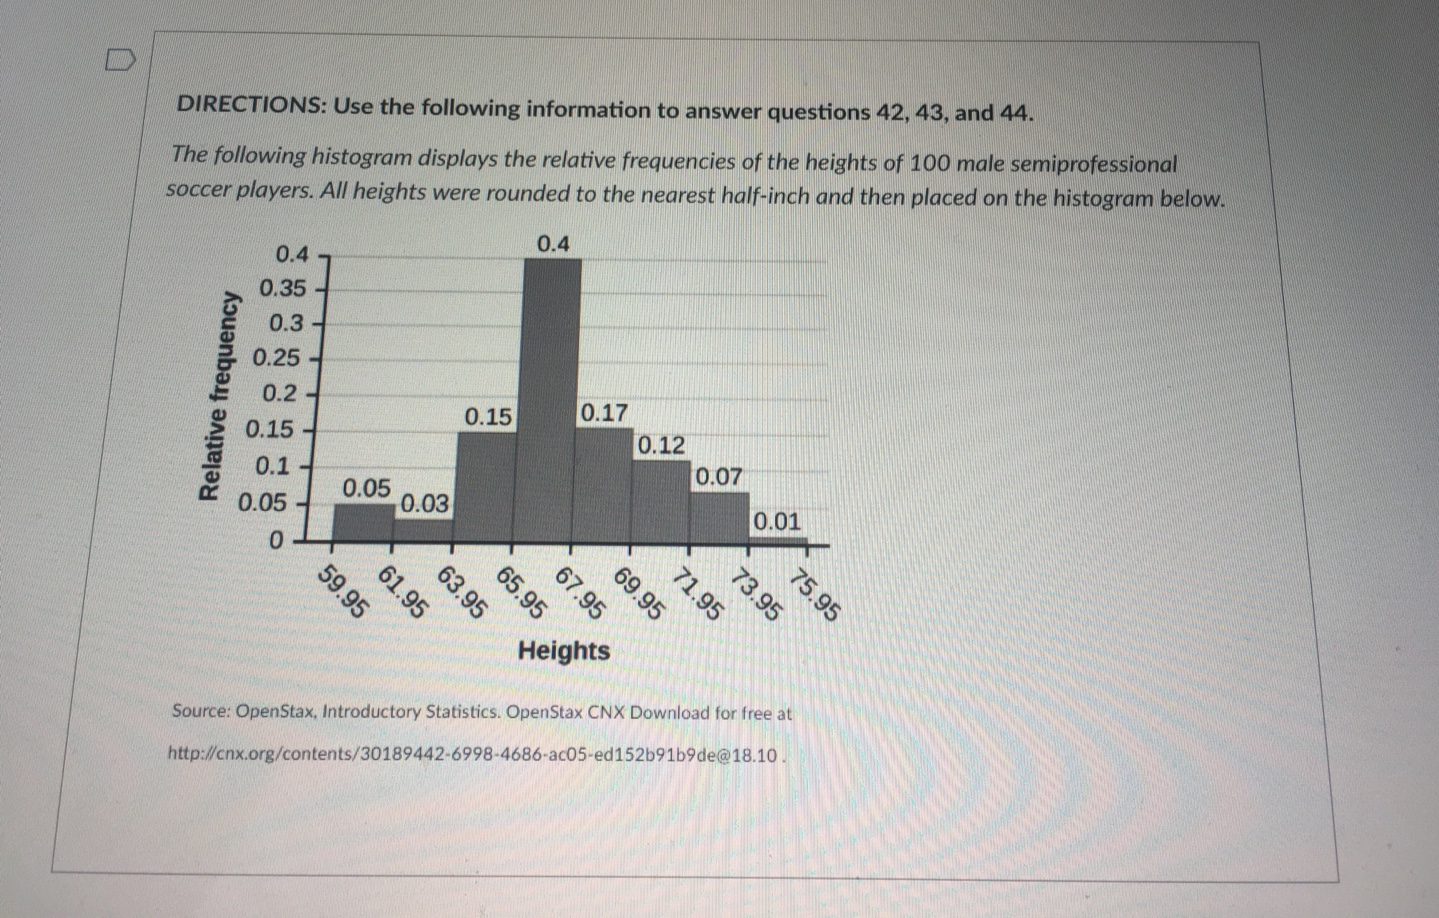
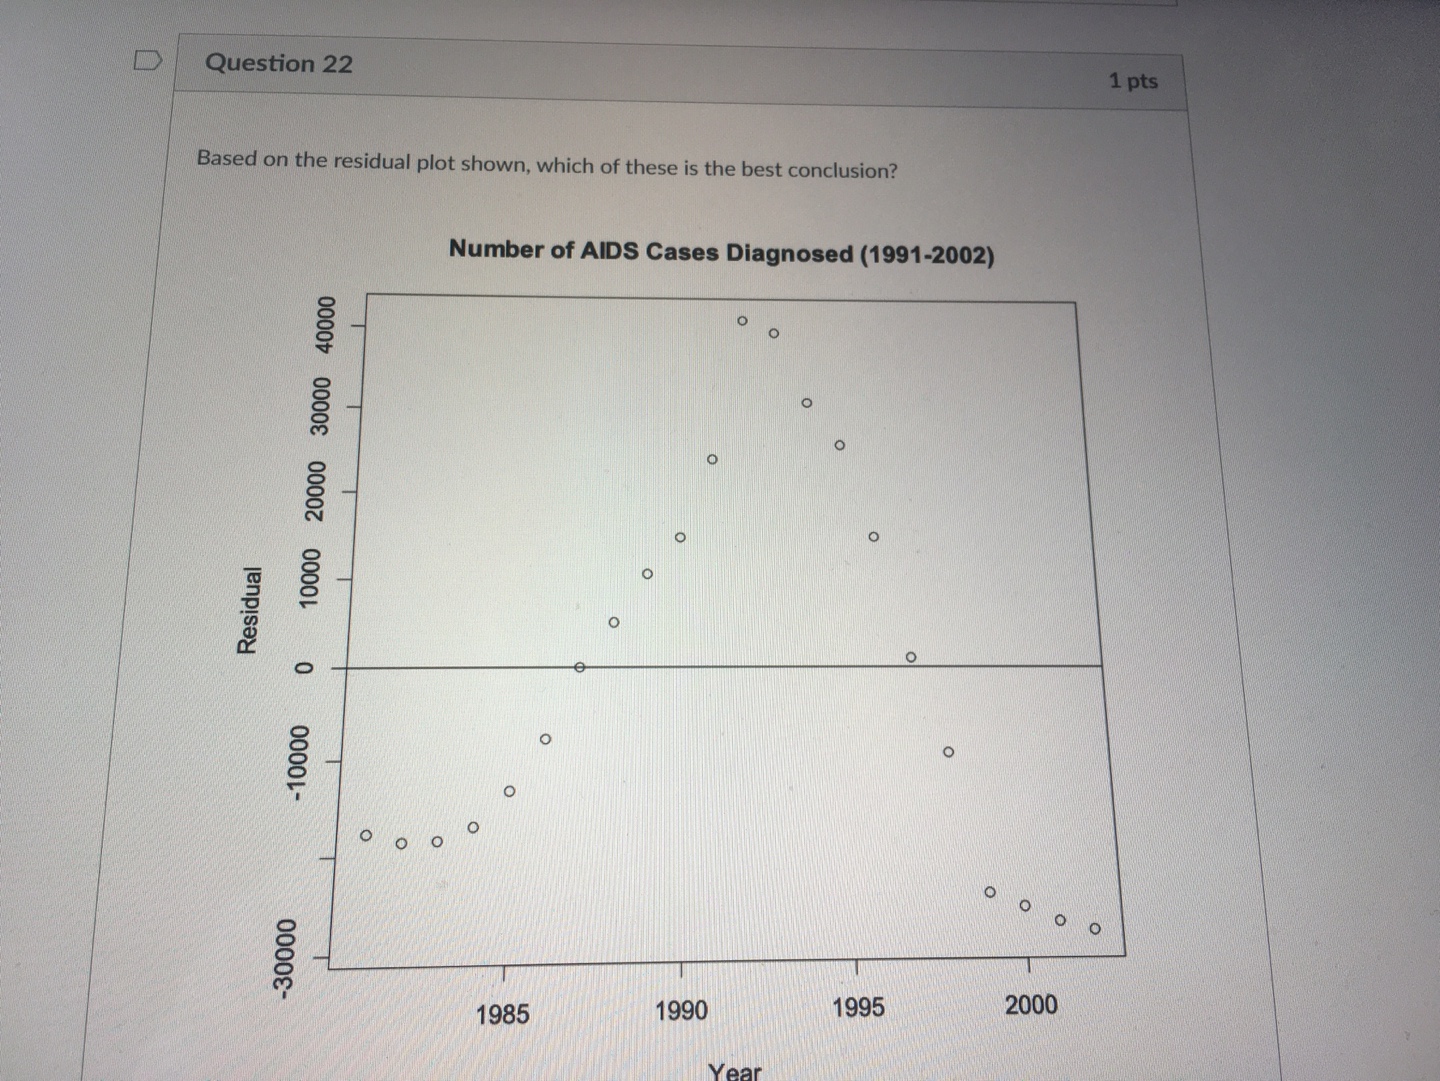
Resi -10000 O O O O O -30000 1985 1990 1995 2000 Year Image source: OpenStax, Introductory Statistics. OpenStax CNX Download for free at http://cnx.org/contents/30189442-6998- 4686-ac05-ed152b91b9de@18.10 The best model for the data is linear because the residuals are above and below the x-axis approximately equally. The best model for the data is linear because the residuals are randomly distributed above and below the x- axis. A linear model is not the best fit for the data because the residuals are not randomly distributed above and below the x-axis. O A linear model is not the best fit for the data because the residuals are above and below the x-axis approximately equally. O A linear model is not the best fit for the data because the residuals are randomly distributed above and below the x-axis.DIRECTIONS: Use the following information to answer questions 42, 43, and 44. The following histogram displays the relative frequencies of the heights of 100 male semiprofessional soccer players. All heights were rounded to the nearest half-inch and then placed on the histogram below. 0.4 0.4 0.35 0.3 0.25 Relative frequency 0.2 0.15 0.17 0.15 0.12 0.1 0.07 0.05 0.05 0.03 0.01 0 5 63.95 67.95 $9.95 71.95 73.95 75.95 95 61.95 6'99 Heights Source: OpenStax, Introductory Statistics. OpenStax CNX Download for free at http://cnx.org/contents/30189442-6998-4686-ac05-ed152b91b9de@18.10D Question 42 1 pts How many total soccer players reported a height of 66 in., 66.5 in., 67 in., or 67.5 in.? 0 4 O 14 40 0 57 O 60 D Question 43 1 pts Which of these features best describes the distribution? Skewed left Skewed right Symmetric Bimodal O UniformD Question 44 1 pts If you were to randomly select one of these 100 male soccer players, what is the probability that you select one who is taller than 69.5 in.? 0.12 O 0.19 0.20 O 0.37 O 0.80D Question 22 1 pts Based on the residual plot shown, which of these is the best conclusion? Number of AIDS Cases Diagnosed (1991-2002) O 10000 20000 30000 40000 C O O O Residual O O O O O -10000 o O O O ON -30000 1985 1990 1995 2000 Year