this is statistics course and I need help with answering these questions. I attached formulas in case you can use it as a reference.Thank you
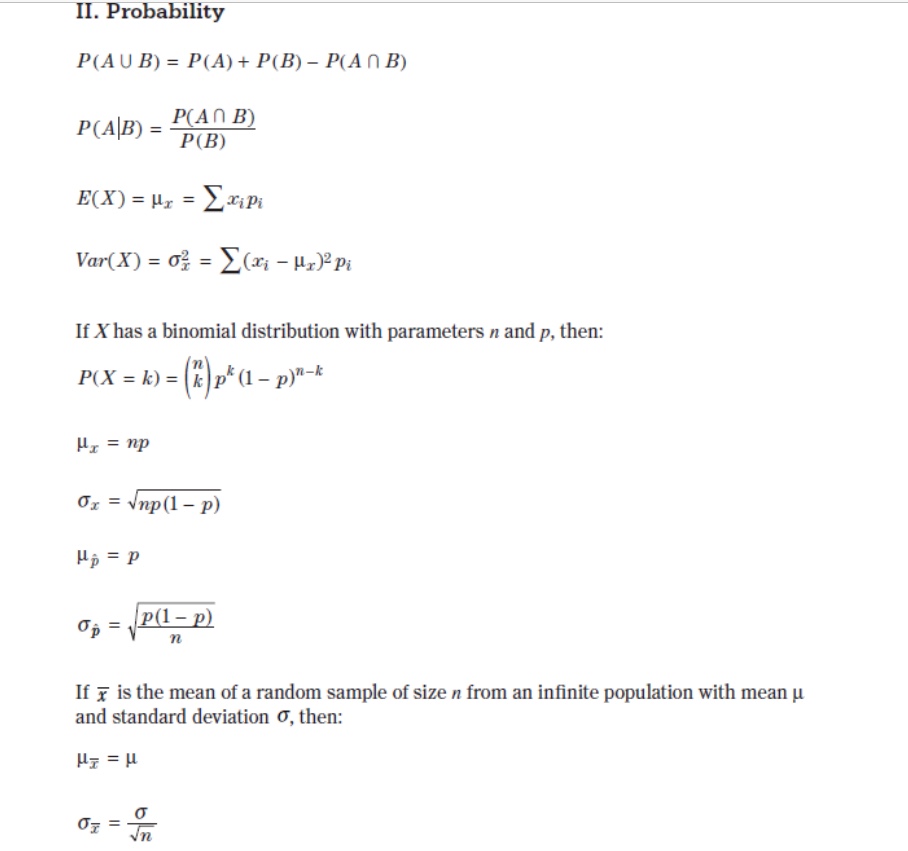
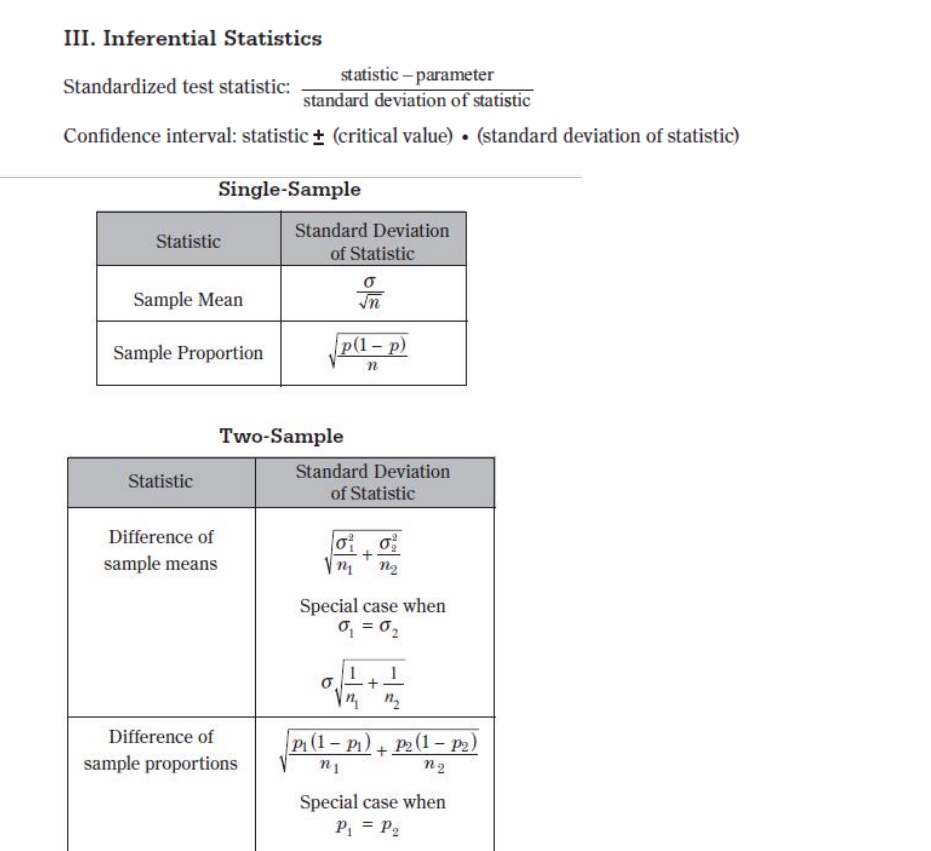
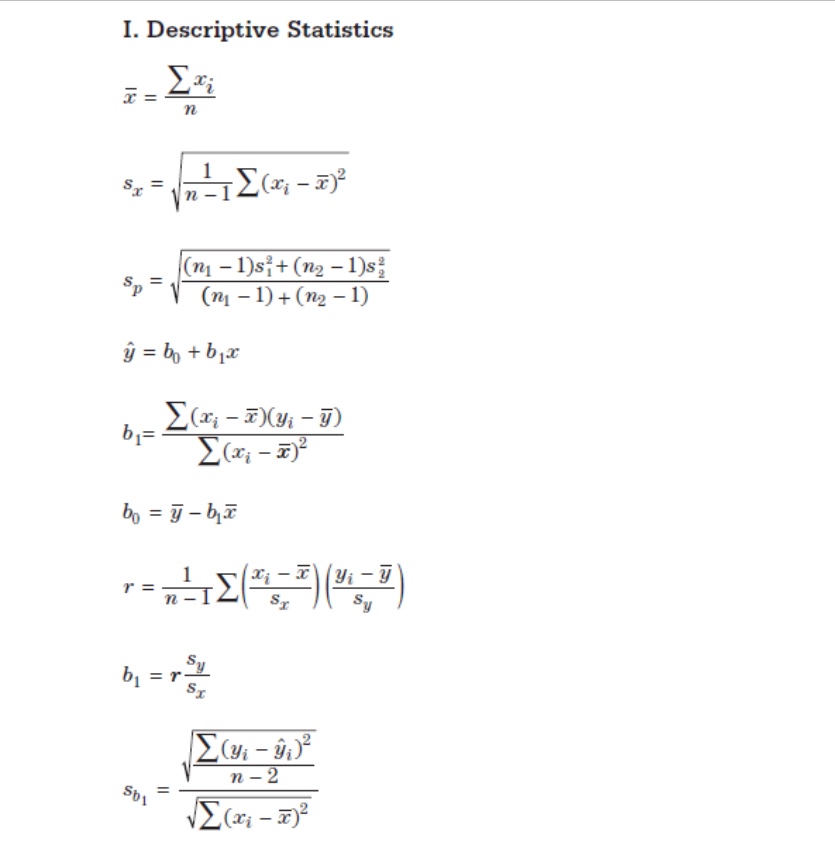
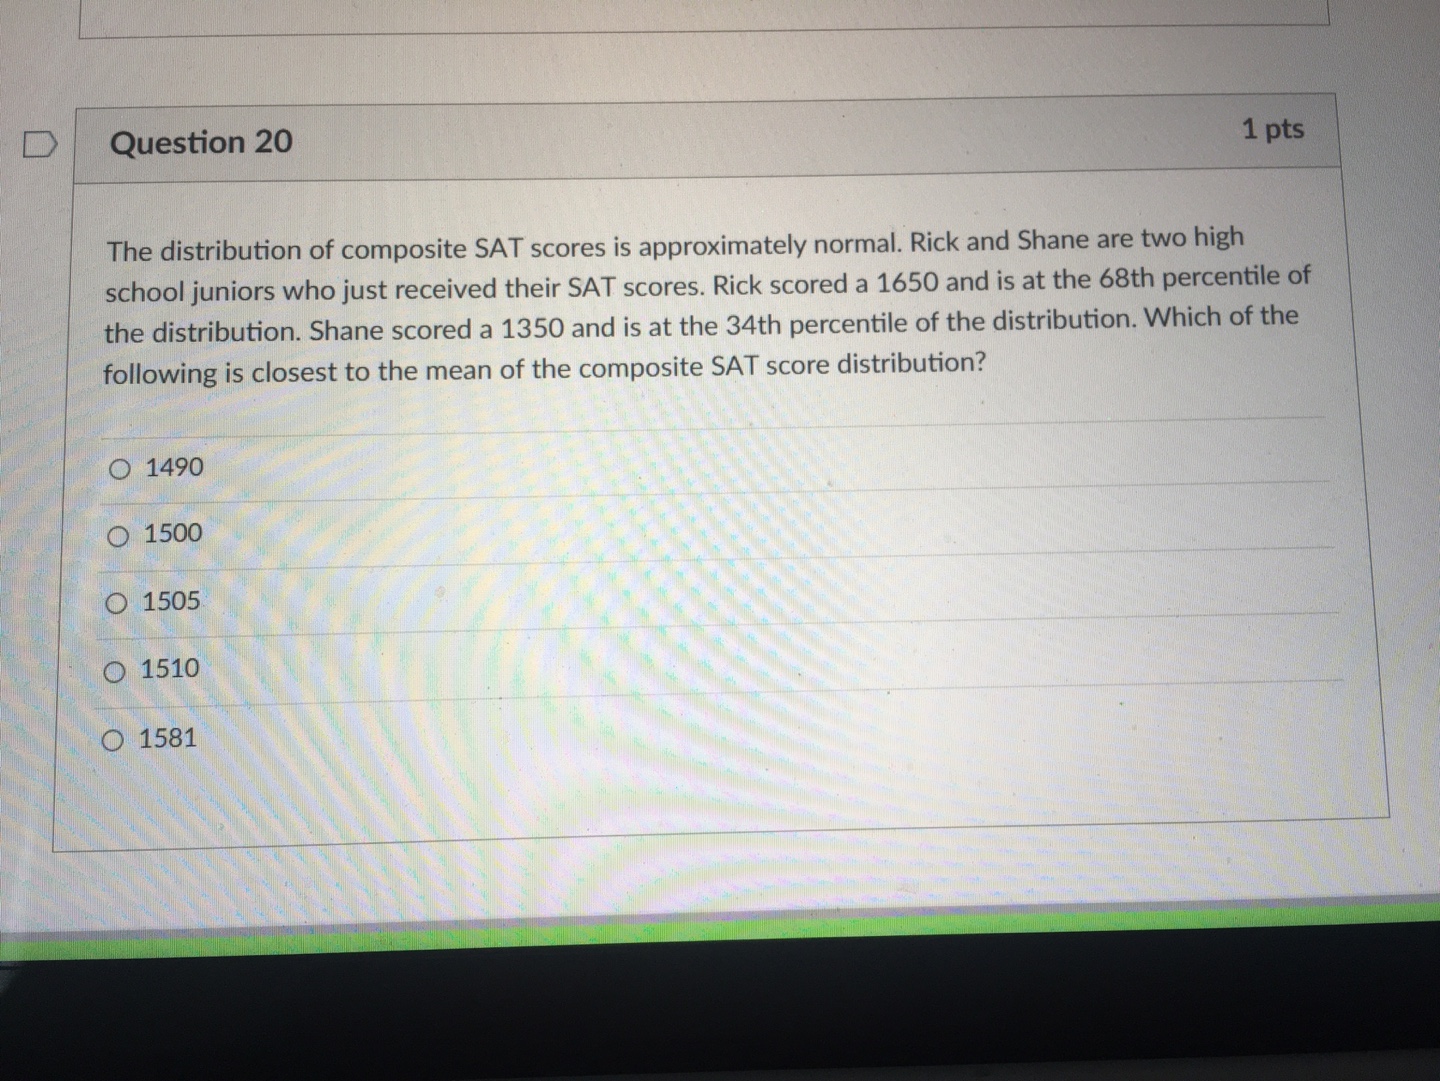
II. Probability PM U B) = PM) + P(B] Pull n B) m = Lag?) Var-(X) = 0% = 2m 11:39-19: If X has a binomial distribution with parameters :1 and p, then: P(X = k) = (:)pt(1_ 13)": \"3:74!\" If E la the mean ofa random sample ofsize n from an innite population with mean p and standard deviation 0', then: T 0' \"i=7: III. Inferential Statistics Standardized test statistic: statistic - parameter standard deviation of statistic Confidence interval: statistic + (critical value) . (standard deviation of statistic) Single-Sample Statistic Standard Deviation of Statistic Sample Mean Sample Proportion p(1 - p) n Two-Sample Statistic Standard Deviation of Statistic Difference of sample means n2 Special case when 0 =02 Difference of P (1 - PI) + P2 (1 - P2) sample proportions n 1 n2 Special case when P = P2\fD Question 20 1 pts The distribution of composite SAT scores is approximately normal. Rick and Shane are two high school juniors who just received their SAT scores. Rick scored a 1650 and is at the 68th percentile of the distribution. Shane scored a 1350 and is at the 34th percentile of the distribution. Which of the following is closest to the mean of the composite SAT score distribution? O 1490 1500 1505 1510 1581D Question 19 1 pts The statistics below provide a summary of the distribution of heights, in inches, for a simple random sample of 300 young children. Mean: 44 Median: 43 Standard Deviation: 3 First Quartile: 40 Third Quartile: 45 About 150 children in the sample have heights that fall into which category? less than 40 inches O less than 45 inches O between 40 and 45 inches O between 41 and 47 inches more than 44 inches.D Question 18 1 pts A dataset from 1990 to 2000 was analyzed to compare average household income (x) with average yearly spending on leisure activities (y). The computer output for this regression is given below. Predictor Coef SE Coef T P Constant 639 6. 087 135.98 0 . 000 Income 0 . 67434 0 . 08547 45 .00 0 . 000 S-19. 8376 R-Sq-87 . 3% R-Sq (adj) -87. 7% What is the proper interpretation for the y-intercept in context of this situation? The average income was $639. O When time is zero, the yearly spending on leisure activities was $639. For a family reporting zero household income, the average yearly spending on leisure activities would be $639. When $0 is spent on leisure activities, the average income would be $639. O The y-intercept cannot be interpreted in the context of this problem.O 5.9 D Question 17 1 pts The equation of a least squares regression line is y = 3.7 + 0.15x. What is the residual for the point (2, 5)? O 4.25 O 1.70 O 1.00 O 4.22 O 7.55