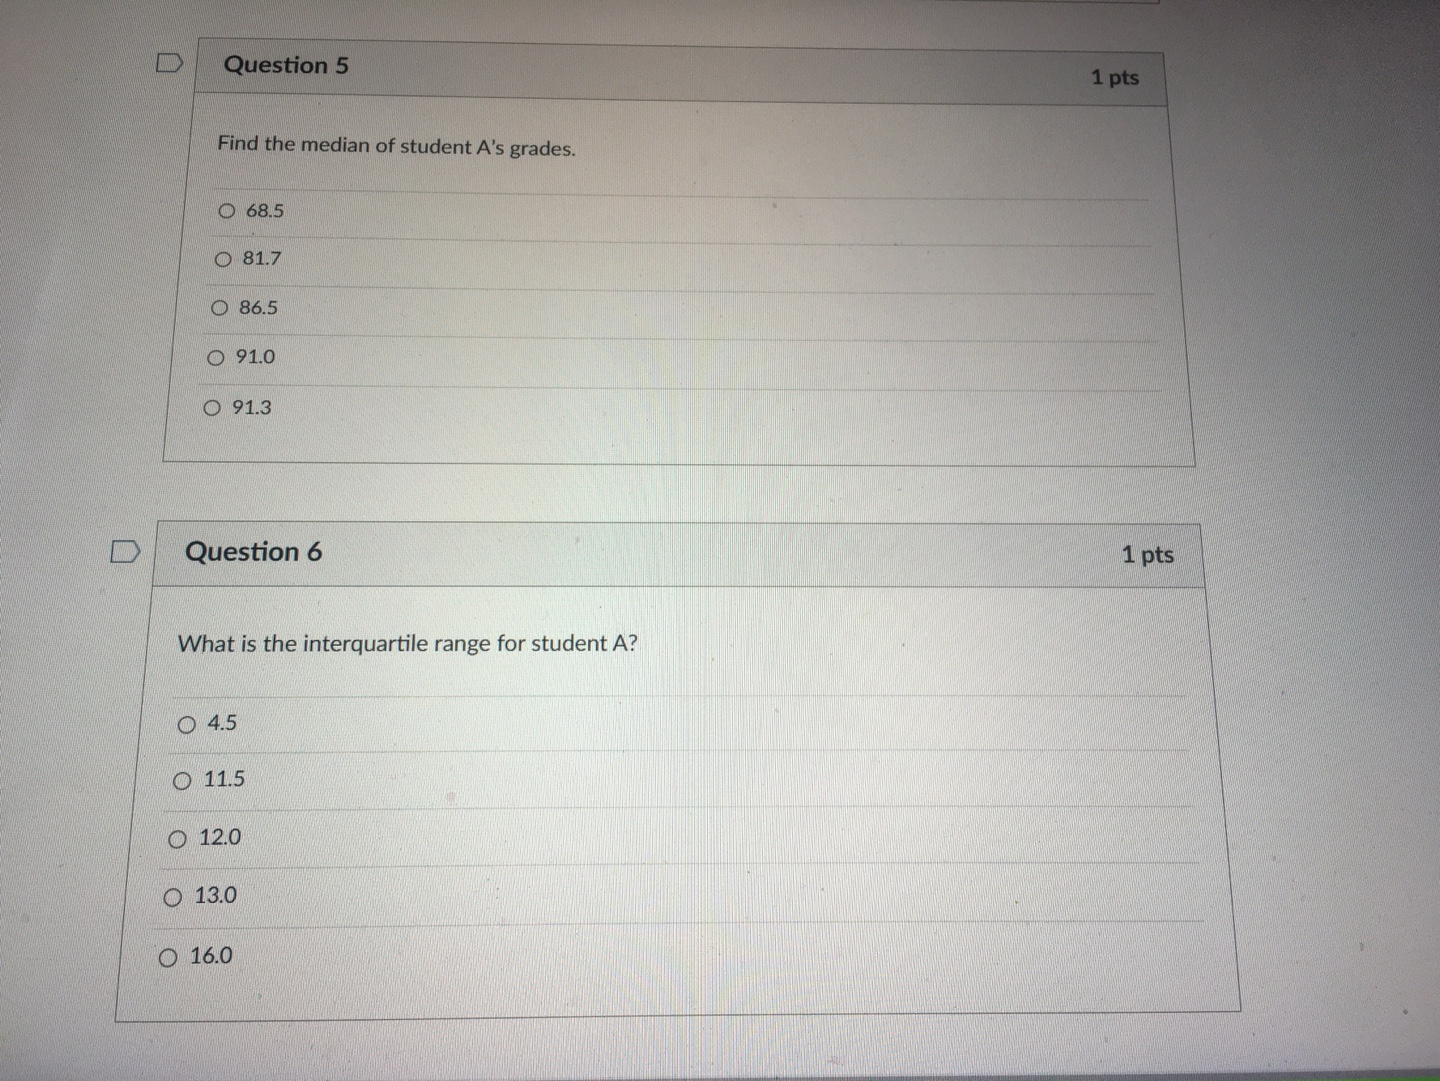
this is statistics course and I need help with answering these questions. I attached formulas in case you can use it as a reference.Thank you
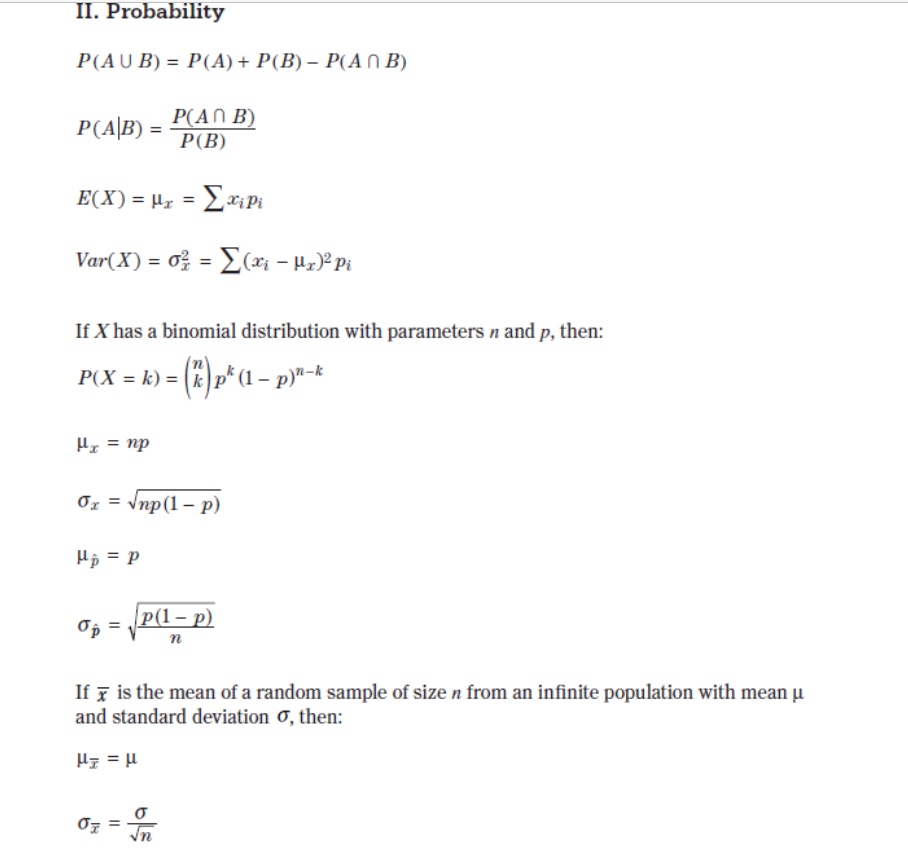
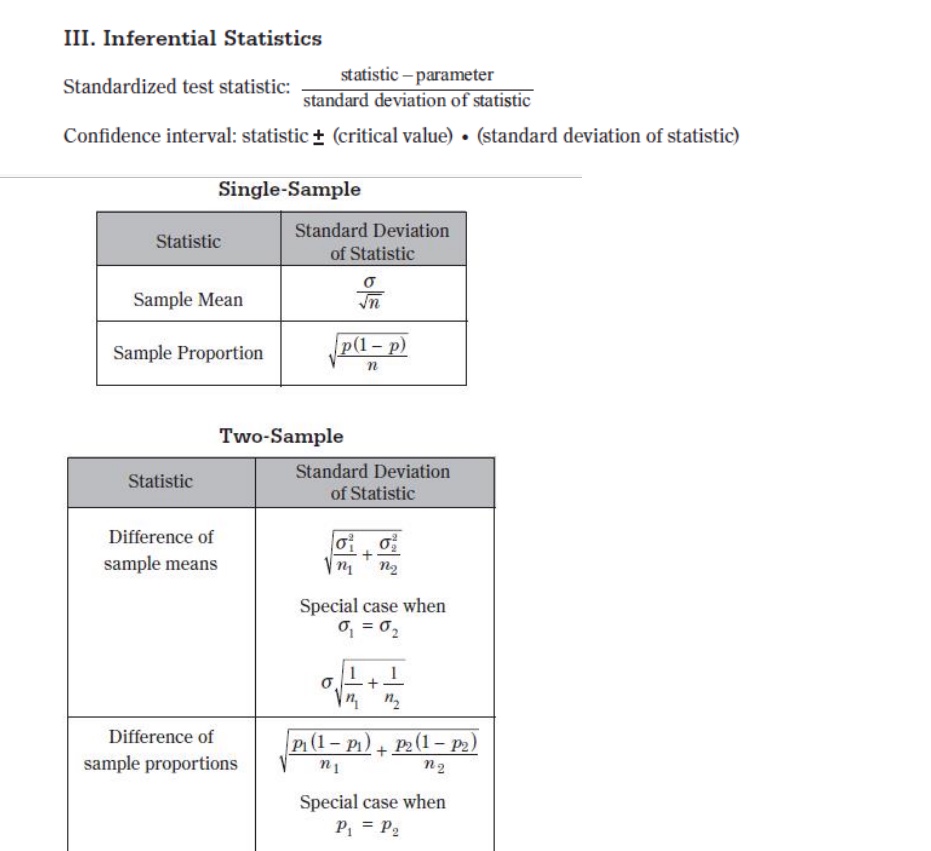
II. Probability PM U B) = PM) + P(B] Pull n B) m = Lag?) Var-(X) = 0% = 2m 11:39-19: If X has a binomial distribution with parameters :1 and p, then: P(X = k) = (:)pt(1_ 13)": \"3:74!\" If E la the mean ofa random sample ofsize n from an innite population with mean p and standard deviation 0', then: T 0' \"i=7: III. Inferential Statistics Standardized test statistic: statistic - parameter standard deviation of statistic Confidence interval: statistic + (critical value) . (standard deviation of statistic) Single-Sample Statistic Standard Deviation of Statistic Sample Mean Sample Proportion p(1 - p) n Two-Sample Statistic Standard Deviation of Statistic Difference of sample means n2 Special case when 0 =02 Difference of P (1 - PI) + P2 (1 - P2) sample proportions n 1 n2 Special case when P = P2\fD Question 3 1 pts Which of these is NOT a fair comparison of these representations? The stem plot is better than the pie chart if you need to compare the students' performances to one another. The pie chart is better than the box plot if you wish to see one student's performance by grade earned. The stem plot is better than the box plot if you wish to know the mode. It is easier to see the mean score of each student by looking at the box plot than the stem plot. It is easier to see the range of data by looking at the box plot than the pie chart. D Question 4 1 pts Which of the following must be true? There are no outliers for either student. Student A has a higher mean score, but Student B has a higher median score. Student B has a higher range than student A. For both students combined, there were as many scores in the 60s as there were in the 80s. Student B's scores had a higher standard deviation than student A's scores.\fO 11.5 O 12.0 O 13.0 16.0 D Question 7 1 pts At the last week of the class, the professor offers to replace each student's lowest score with a 100% for completion of an extra credit project. If both students complete the project, which of these must be true? Student B will now have a higher mean grade than student A. The 100% grade will now be an outlier for each student Student B's mean grade will improve by a greater amount than student A's mean grade. The median for student A will not change. The interquartile range for student A increased.D DIRECTIONS: Use the following information to answer questions 3-7. Shown below are different ways to represent six quiz scores for two students in a summer statistics class where a score less than a 70% is an F, 70% to 79% is a C, 80% to 89% is a B, and anything above 90% is an A. Student A Student B 10 20 30 40 50 60 70 80 90 100 Quiz Scores Student A Student B Student A Quiz Scores 8 UT 9 B's A's 33% 33% W 5 455 1796 1796 94 8 31