

Answered step by step
Verified Expert Solution
Question
1 Approved Answer
This is supposed to be done via MATLAB coding, but we are lost. Thanks in advance. Task 1: Model setup Start a new population model
This is supposed to be done via MATLAB coding, but we are lost. Thanks in advance.
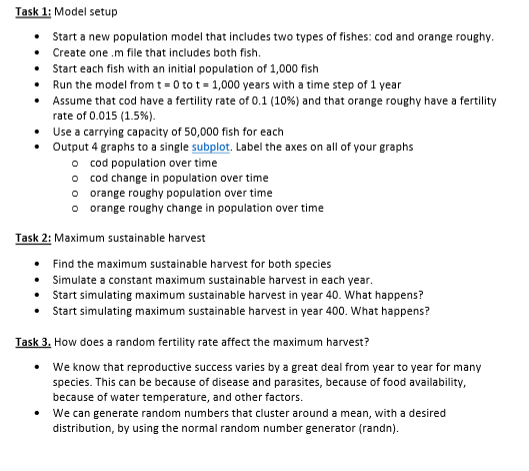
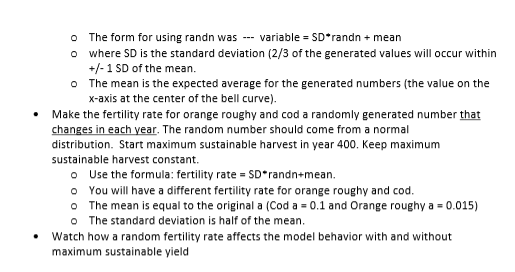
Task 1: Model setup Start a new population model that includes two types of fishes: cod and orange roughy Create one .m file that includes both fish. . . Start each fish with an initial population of 1,000 fish .Run the model from t-0 tot-1,000 years with a time step of 1 year Assume that cod have a fertility rate of 0.1 (10%) and that orange roughy have a fertility rate of 0.015 (1.596) .Use a carrying capacity of 50,000 fish for each Output 4 graphs to a single subplot. Label the axes on all of your graphs o cod population over time o cod change in population over time o orange roughy population over time o orange roughy change in population over time Task 2: Maximum sustainable harvest .Find the maximum sustainable harvest for both species .Simulate a constant maximum sustainable harvest in each year .Start simulating maximum sustainable harvest in year 40. What happens? .Start simulating maximum sustainable harvest in year 400. What happens? Task 3. How does a random fertility rate affect the maximum harvest? . We know that reproductive success varies by a great deal from year to year for many species. This can be because of disease and parasites, because of food availability because of water temperature, and other factors . We can generate random numbers that cluster around a mean, with a desired distribution, by using the normal random number generator (randn) o The form for using randn was variable SD*randn mean o where SD is the standard deviation (2/3 of the generated values will occur within t1 SD of the mean. o The mean is the expected average for the generated numbers (the value on the x-axis at the center of the bell curve) *Make the fertility rate for orange roughy and cod a randomly generated number that changes in each year. The random number should come from a normal distribution. Start maximum sustainable harvest in year 400. Keep maximum sustainable harvest constant. o Use the formula: fertility rate- SD randn+mean. o You will have a different fertility rate for orange roughy and cod o The mean is equal to the original a (Cod a 0.1 and Orange roughy a 0.015) o The standard deviation is half of the mean . Watch how a random fertility rate affects the model behavior with and without maximum sustainable yieldStep by Step Solution
There are 3 Steps involved in it
Step: 1

Get Instant Access to Expert-Tailored Solutions
See step-by-step solutions with expert insights and AI powered tools for academic success
Step: 2

Step: 3
Ace Your Homework with AI
Get the answers you need in no time with our AI-driven, step-by-step assistance
Get Started
Transactions On Large Scale Data And Knowledge Centered Systems Xxviii Special Issue On Database And Expert Systems Applications Lncs 9940
Authors: Abdelkader Hameurlain ,Josef Kung ,Roland Wagner ,Qimin Chen
1st Edition
3662534541, 978-3662534540