Question
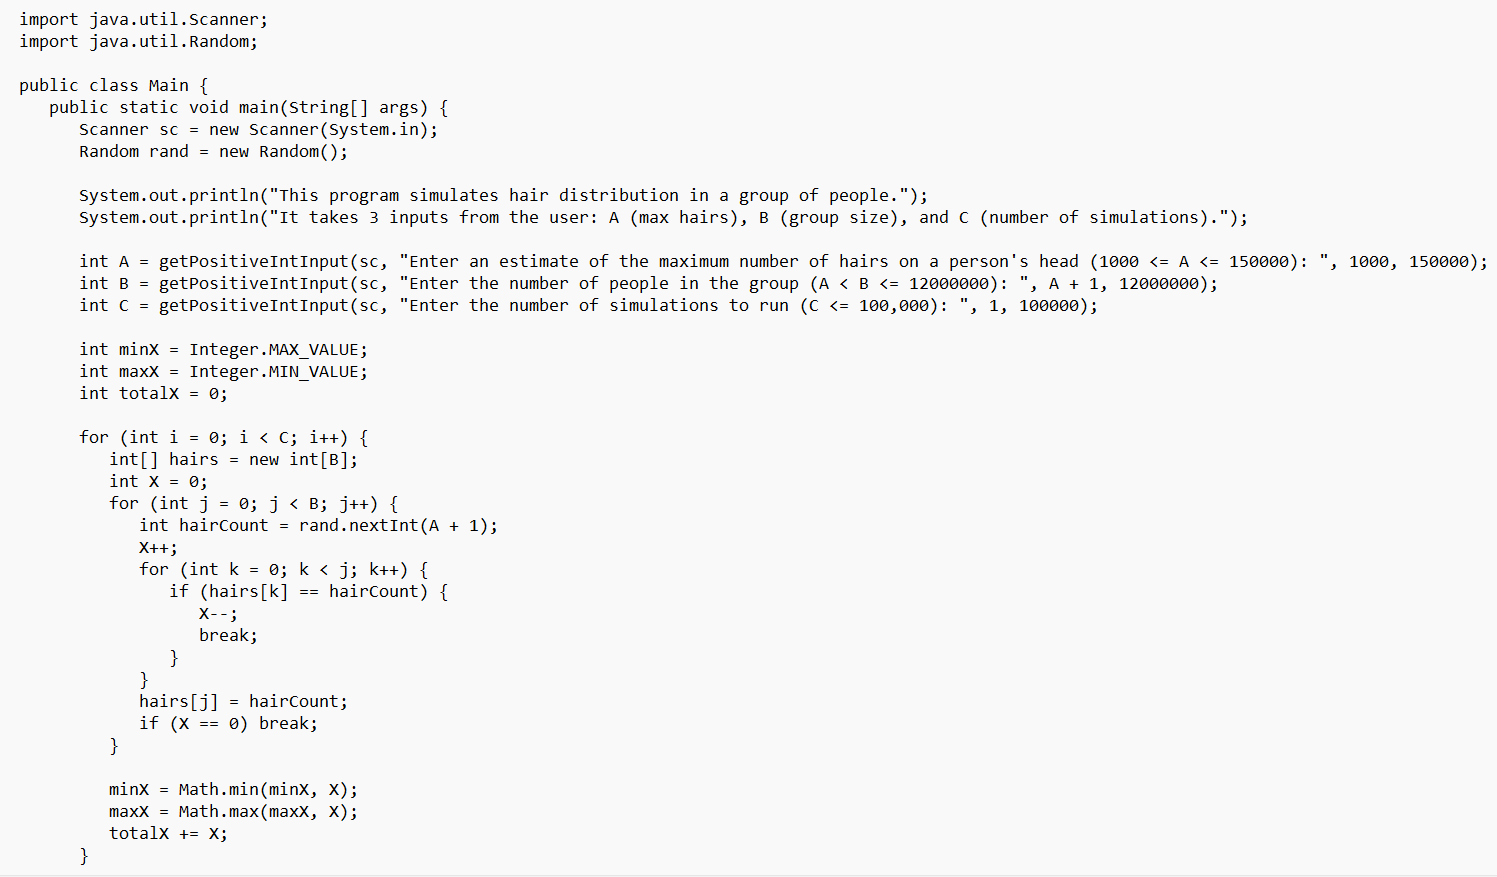
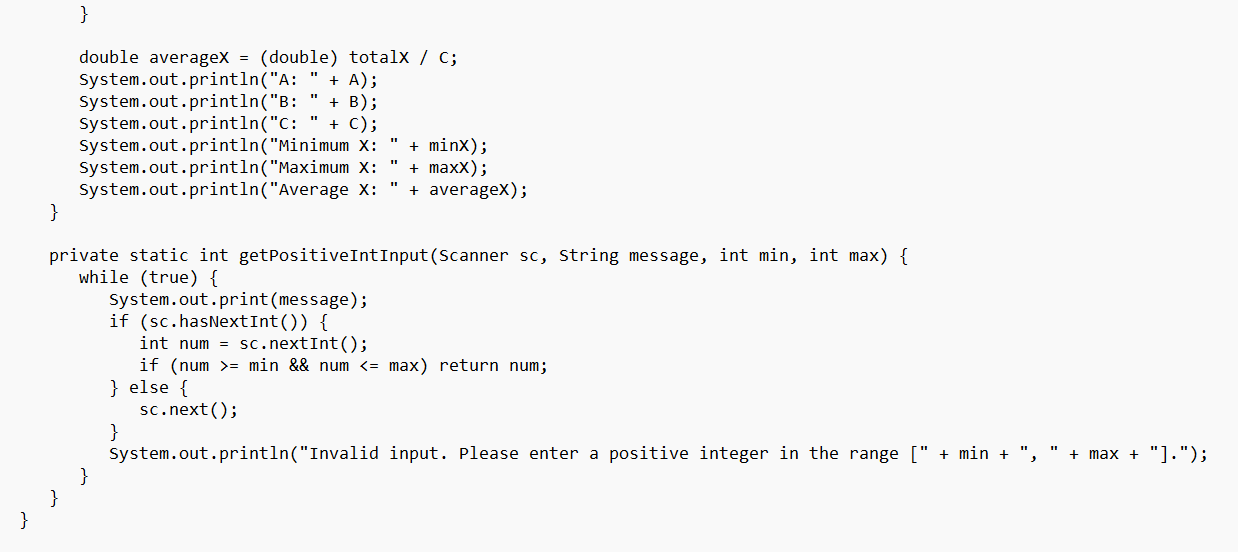
This is the code for Assignment 1: The code must be written in java. Carefully read all the requirements of this assignment and then answer.
This is the code for Assignment 1: The code must be written in java. Carefully read all the requirements of this assignment and then answer. Please do not copy and just page from others' posts.


Our first HW2 task is to use your work on HW1 to construct a subprogram (a function, a subroutine, or some other designation in the programming language you chose) that takes two input parameters: A and C; and the subprogram also outputs four numbers: B, the minimum number of people to find a match, the maximum number of people to find a match, and the average number of people to find a match. The subprogram always sets B to A+1, and then runs the simulation C times, keeping track of minimum, maximum, and average. Your main program then uses the five numbers to fill out the tables described below. You are REQUIRED to have a subprogram that does this work. The subprogram should include an opening comment that describes all the parameters, and what the subprogram does. The subprogram, unlike the analogous HW1 program does NOT print out to the screen. Instead, the subprograms data will be incorporated into two tables described below.
When your program begins, it should print to the screen an explanation of what the program will do. This explanation should fit on one screen (so it cant be too long), but it should communicate the idea of the program.
Next, your program should prompt the interactive user for one positive integer N that follows the following inequality: 3
Here I am showing a Table 1 when N = 4. The numbers in the last three columns are not fixed... they are likely to vary each time you run the program. In Table 1, The Max Hairs numbers should always start at 1000, and then proceed to the next power of 10 for 3, 4, 5, 6, or 7 lines total (depending on N). The number of people (the second column) should always be one more than the matching Max Hairs number of that row. For Table 1, the number of simulations (third column) should be fixed at 1000. The last three columns should be filled in by your program by running the simulations defined by the three numbers (corresponding to A, B, and C in HW1). Ive left them blank here, but they should be filled in when you run your program.  Table 2 is similar to Table 1, but not identical. In Table 1, the number of simulations is fixed, and the maximum number of hairs changes. In Table 2, the maximum number of hairs is fixed, and the number of simulations changes. Here is an example of a Table 2, again with N=4. Note that the number of simulations in Table 2 always starts at 100, and goes up by a factor of 10 in each subsequent row. Note that the first three columns in Table 2 are in a different order from the columns in Table 1, but the last three columns are in the same order. Both in Table 1 and Table 2, the actual numbers for the last 3 columns will vary each time you run your program since randomness figures into the calculations. However, hopefully trends will become clear as you run your HW2 program over and over.
  After your program runs, show both tables, and pause (with an appropriate message) so the interactive user can look at your tables. When the user pushes ENTER, print a final message in which you point out a trend or trends that you discerned in the data your HW2 generates. Again, prompt the user to push ENTER to finish the program. Your message about trends could include something like as the number of hairs increases, the average number to a match tends to... or as the number of simulations increases, the minimum... The results in your tables should support your message.
When your program prompts for N, it should make clear what is required. If the user enters anything inappropriate, the program should print a descriptive error message to the screen, and reprompt. This cycle should continue until the interactive user has entered a positive integer in the proper range. Your grade depends partly on how good your error messages are for inappropriate responses from the user. The more specific your error messages, the better.
Please carefully follow all the steps and answer correctly: Note that Tables 1 and 2 are different so Kindly write them differently. The output must match the tables above. Please attach all the outputs. Thank You for your help
ort java.util. Random; Table 1 Table 2Step by Step Solution
There are 3 Steps involved in it
Step: 1

Get Instant Access to Expert-Tailored Solutions
See step-by-step solutions with expert insights and AI powered tools for academic success
Step: 2

Step: 3

Ace Your Homework with AI
Get the answers you need in no time with our AI-driven, step-by-step assistance
Get Started


