This is the complete question # 2. I can upload the complete pages from where this question was taken.
 I need help with question number 2 only.
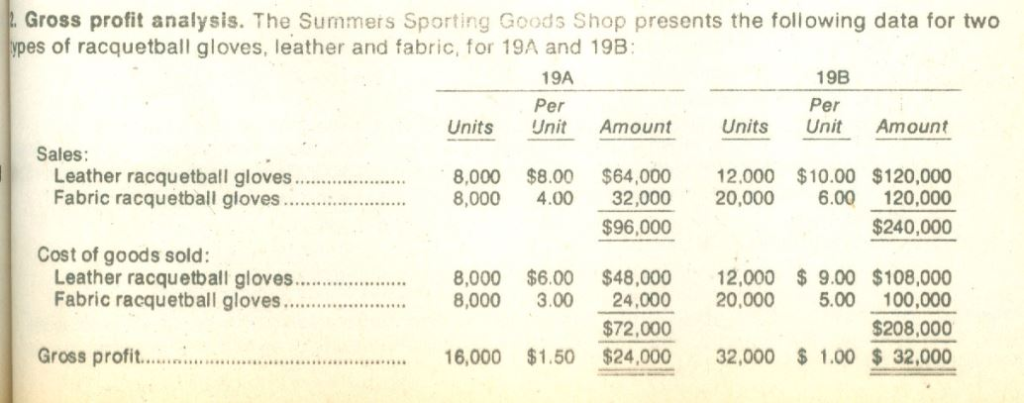
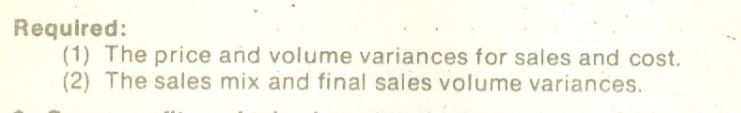
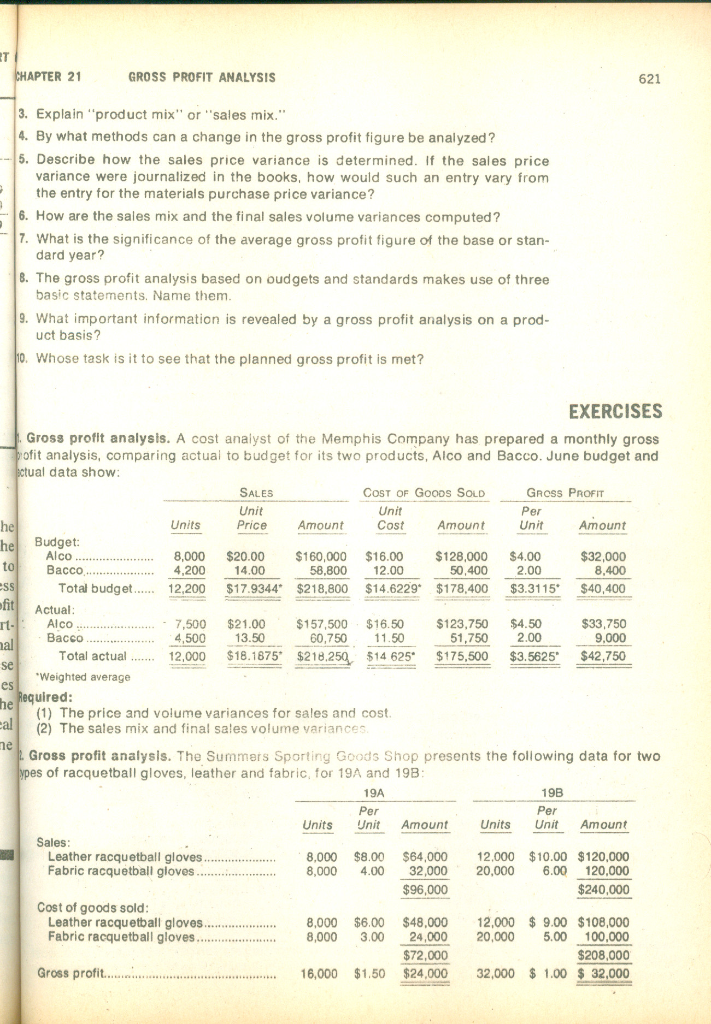
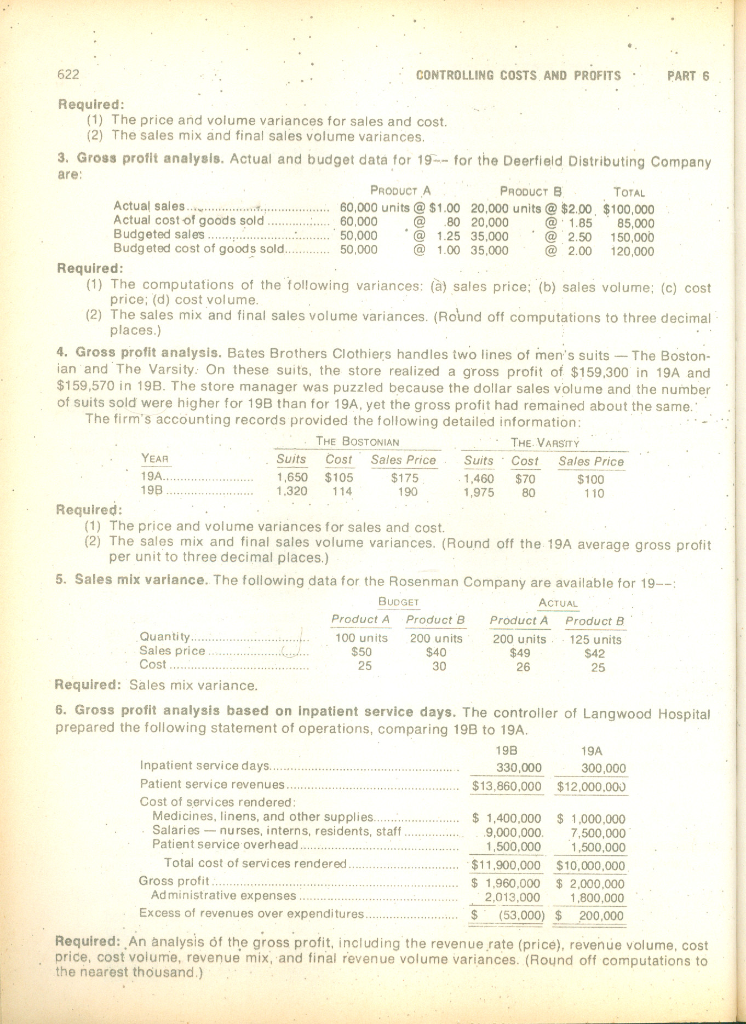
Gross profit analysis. The Summers Sporting Goods Shop presents the following data for two pes of racquetball gloves, leather and fabric, for 19A and 19B 19A Per 19B Per Units Unit Amount Units Unit Amount Sales: 8,000 $8.00 $64,000 12.000 $10.00 $120,000 Leather racquetball gloves. Fabric racquetball gloves. 8,000 4.00 32,000 20,000 6.00 120,000 $240,000 $96,000 Cost of goods sold: Leather racquetball gloves.8,000 $6.00 $48,000 12,000 9.00 $108,000 Fabric racquetball gloves .. $72,000 $208,000 Gross profit.6,000 $1.50 $24.000 32,000 1.00 32,000 Required: (1) The price and volume variances for sales and cost. (2) The sales mix and final sales volume variances. APTER 21 GROSS PROFIT ANALYSIS 621 3. Explain "product mix" or "sales mix." . By what methods can a change in the gross profit figure be analyzed? 5. Describe how the sales price variance is determined. If the sales price variance were journalized in the books, how would such an entry vary from the entry for the materials purchase price variance? 6. How are the sales mix and the final sales volume variances computed? 7. What is the significance of the average gross profit figure of the base or stan- dard year? 8. The gross profit analysis based on oudgets and standards makes use of three 9. What important information is revealed by a gross profit analysis on a prod- 0. Whose task is it to see that the planned gross profit is met? basic statements. Name them uct basis? EXERCISES Gross proft analysis. A cost analyst of the Memphis Company has prepared a monthly gross ofit analysis, comparing actual to budget for its two products, Alco and Bacco. June budget and ual data show SALES Unit Price COST OF GooDS SOLD GRoss PROFIT Unit Cost er Units Amount Amount Unit Amount he Budget Alco $32,000 8,400 Total budget12,200 $17.9344 $218,800 $14.6229 $178,400 $3.3115 $40,400 8,000 $20.00 $160,000 $16.00$128,000 $4.00 50,400 2.00 58,800 12.00 fit rt Actual Alco... Bacco.... 7,500 $21.00 $157,500 $16.50 $123,750 $4.50 51,750 2.00 $33,750 9,000 12,000 $18.1875 $218,250 $14 625 $175,500 $3.5625 $42,750 60,750 11.50 Total actual2 se Weighted average equired: es he (1) The price and volume variances for sales and cost a(2) The sales mix and final sales volume variances le Gross profit analysis. The Summers Sporting Goods Shop presents the following data for two s of racquetball gloves, leather and fabric, for 19A and 19B 19B Per 19A Per Units Unit Amount Units Unit Amount Sales Leather racquetball gloves 8,000 $8.00 $64,000 12.000 $10.00 $120,000 8,000 4.00 32,000 20,000 6.00 120,000 $240,000 Fabric racquetball gloves $96,000 Cost of goods sold 8,000 $6.00 $48,000 2,000 9.00 $108,000 Leather racquetball gloves... $208,000 16,000 $1.50 $24,000 32,000 1.00 $ 32,000 $72,000 Gross profit 622 CONTROLLING COSTS AND PROFITS PART 6 Required: (1) The price and volume variances for sales and cost. (2) The sales mix and final sales volume variances. 3. Gross profit analysis. Actual and budget data for 19 for the Deerfield Distributing Company are: PRODUCT E PRODUCTA TOTAL Actual sale0,00 units @$1.00 20,000 units@ $2.00, $100,000 Actual cost of goods sold.,000 80 20,000 1.85 85,000 Budgeted sales Budgeted cost of goods sold50,000 50,000 1.25 35,000 2.50 150,000 1.00 35,0002.00 120,000 Required (1) The computations of the following variances: (a) sales price; (b) sales volume; (c) cost price; (d) cost volume (2) The sales mix and final sales volume variances. (Round off computations to three decimal places.) 4. Gross profit analysis. Bates Brothers Clothiers handles two lines of men's suits The Boston- ian and The Varsity: On these suits, the store realized a gross profit of $159,300 in 19A and $159,570 in 19B. The store manager was puzzled because the dollar sales volume and the number of suits sold were higher for 19B than for 19A, yet the gross profit had remained about the same The firm's accounting records provided the following detailed information THE VARSITY THE BOSTONIAN YEAR Suits Cost Sales Price Suits Cost Sales Price 1,650 $105 1320 114 $175 1,460 $70 1,975 80 $100 110 Required (1) The price and volume variances for sales and cost. (2) The sales mix and final sales volume variances. (Round off the 19A average gross profit per unit to three decimal places.) 5. Sales mix variance. The following data for the Rosenman Company are available for 19-- BUDGET ACTUAL Product A Product B Product A Product B Quantity Sales price... Cost 100 units 200 units 200 units 125 units $50 $40 $49 26 25 Required: Sales mix variance 6. Gross profit analysis based on inpatient service days. The controller of Langwood Hospital prepared the following statement of operations, comparing 19B to 19A 198 330,000 19A Inpatient service days 300,000 $13,860,000 $12,000,000 Cost of services rendered Medicines, linens, and other supplies1,400,000 $ 1,000,000 7,500,000 1,500,000 1,500,000 ...." _n_.t_. .$11,900,000 $10,000,000 $1,960,000 2,000,000 2,013,000 1,800,000 (53,000) 200,000 Salaries nurses, interns, residents, staff.... Patient service overhead.. 9,000.000 Total cost of services rendered Gross profit Ad ministrative expenses Excess of revenues over expenditures Required: An analysis f the gross profit, including the revenue rate (price), revenue volume, cost price, cost volume, revenue mix, and final revenue volume variances. (Round off computations to the nearest thousand.) Gross profit analysis. The Summers Sporting Goods Shop presents the following data for two pes of racquetball gloves, leather and fabric, for 19A and 19B 19A Per 19B Per Units Unit Amount Units Unit Amount Sales: 8,000 $8.00 $64,000 12.000 $10.00 $120,000 Leather racquetball gloves. Fabric racquetball gloves. 8,000 4.00 32,000 20,000 6.00 120,000 $240,000 $96,000 Cost of goods sold: Leather racquetball gloves.8,000 $6.00 $48,000 12,000 9.00 $108,000 Fabric racquetball gloves .. $72,000 $208,000 Gross profit.6,000 $1.50 $24.000 32,000 1.00 32,000 Required: (1) The price and volume variances for sales and cost. (2) The sales mix and final sales volume variances. APTER 21 GROSS PROFIT ANALYSIS 621 3. Explain "product mix" or "sales mix." . By what methods can a change in the gross profit figure be analyzed? 5. Describe how the sales price variance is determined. If the sales price variance were journalized in the books, how would such an entry vary from the entry for the materials purchase price variance? 6. How are the sales mix and the final sales volume variances computed? 7. What is the significance of the average gross profit figure of the base or stan- dard year? 8. The gross profit analysis based on oudgets and standards makes use of three 9. What important information is revealed by a gross profit analysis on a prod- 0. Whose task is it to see that the planned gross profit is met? basic statements. Name them uct basis? EXERCISES Gross proft analysis. A cost analyst of the Memphis Company has prepared a monthly gross ofit analysis, comparing actual to budget for its two products, Alco and Bacco. June budget and ual data show SALES Unit Price COST OF GooDS SOLD GRoss PROFIT Unit Cost er Units Amount Amount Unit Amount he Budget Alco $32,000 8,400 Total budget12,200 $17.9344 $218,800 $14.6229 $178,400 $3.3115 $40,400 8,000 $20.00 $160,000 $16.00$128,000 $4.00 50,400 2.00 58,800 12.00 fit rt Actual Alco... Bacco.... 7,500 $21.00 $157,500 $16.50 $123,750 $4.50 51,750 2.00 $33,750 9,000 12,000 $18.1875 $218,250 $14 625 $175,500 $3.5625 $42,750 60,750 11.50 Total actual2 se Weighted average equired: es he (1) The price and volume variances for sales and cost a(2) The sales mix and final sales volume variances le Gross profit analysis. The Summers Sporting Goods Shop presents the following data for two s of racquetball gloves, leather and fabric, for 19A and 19B 19B Per 19A Per Units Unit Amount Units Unit Amount Sales Leather racquetball gloves 8,000 $8.00 $64,000 12.000 $10.00 $120,000 8,000 4.00 32,000 20,000 6.00 120,000 $240,000 Fabric racquetball gloves $96,000 Cost of goods sold 8,000 $6.00 $48,000 2,000 9.00 $108,000 Leather racquetball gloves... $208,000 16,000 $1.50 $24,000 32,000 1.00 $ 32,000 $72,000 Gross profit 622 CONTROLLING COSTS AND PROFITS PART 6 Required: (1) The price and volume variances for sales and cost. (2) The sales mix and final sales volume variances. 3. Gross profit analysis. Actual and budget data for 19 for the Deerfield Distributing Company are: PRODUCT E PRODUCTA TOTAL Actual sale0,00 units @$1.00 20,000 units@ $2.00, $100,000 Actual cost of goods sold.,000 80 20,000 1.85 85,000 Budgeted sales Budgeted cost of goods sold50,000 50,000 1.25 35,000 2.50 150,000 1.00 35,0002.00 120,000 Required (1) The computations of the following variances: (a) sales price; (b) sales volume; (c) cost price; (d) cost volume (2) The sales mix and final sales volume variances. (Round off computations to three decimal places.) 4. Gross profit analysis. Bates Brothers Clothiers handles two lines of men's suits The Boston- ian and The Varsity: On these suits, the store realized a gross profit of $159,300 in 19A and $159,570 in 19B. The store manager was puzzled because the dollar sales volume and the number of suits sold were higher for 19B than for 19A, yet the gross profit had remained about the same The firm's accounting records provided the following detailed information THE VARSITY THE BOSTONIAN YEAR Suits Cost Sales Price Suits Cost Sales Price 1,650 $105 1320 114 $175 1,460 $70 1,975 80 $100 110 Required (1) The price and volume variances for sales and cost. (2) The sales mix and final sales volume variances. (Round off the 19A average gross profit per unit to three decimal places.) 5. Sales mix variance. The following data for the Rosenman Company are available for 19-- BUDGET ACTUAL Product A Product B Product A Product B Quantity Sales price... Cost 100 units 200 units 200 units 125 units $50 $40 $49 26 25 Required: Sales mix variance 6. Gross profit analysis based on inpatient service days. The controller of Langwood Hospital prepared the following statement of operations, comparing 19B to 19A 198 330,000 19A Inpatient service days 300,000 $13,860,000 $12,000,000 Cost of services rendered Medicines, linens, and other supplies1,400,000 $ 1,000,000 7,500,000 1,500,000 1,500,000 ...." _n_.t_. .$11,900,000 $10,000,000 $1,960,000 2,000,000 2,013,000 1,800,000 (53,000) 200,000 Salaries nurses, interns, residents, staff.... Patient service overhead.. 9,000.000 Total cost of services rendered Gross profit Ad ministrative expenses Excess of revenues over expenditures Required: An analysis f the gross profit, including the revenue rate (price), revenue volume, cost price, cost volume, revenue mix, and final revenue volume variances. (Round off computations to the nearest thousand.)