

Question
This is the first part done need help with second part using this information instructions for second part Statistical Analyses- Due Week 7 Select two
This is the first part done need help with second part using this information instructions for second part Statistical Analyses- Due Week 7
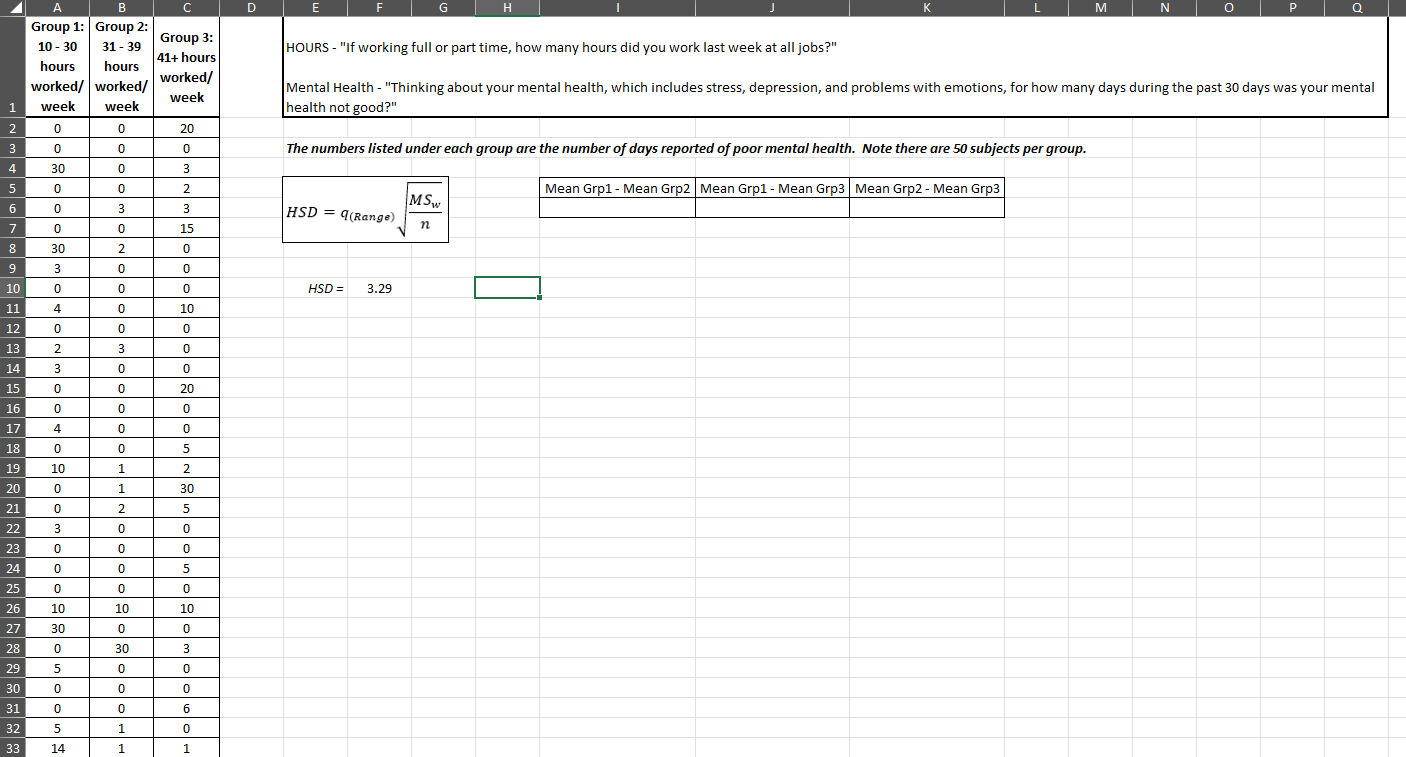
Select two relevant variables from the GSS dataset based on the identified problem/issue as presented in the introduction portion of the assignment. See Abbott (2017) Chapter 9: Excel Procedures with One-way ANOVA for the steps on completing the analysis, and Abbott (2017) Chapter 9: Figures 9.9 & 9.10 for how the data needs to be set up in Excel so that it can perform the appropriate one-way ANOVA. You will find it helpful to review Abbott (2017)'s example for the statistical interpretation/important factors to include as presented in Chapter 9: Post Hoc Analysis. The overall presentation of Abbott (2017)'s example can be found in Chapter 9: Are the Assumptions Met?
- You do NOT need to evaluate whether the population is normally distributed.
- You do NOT need to check for homogeneity of variance.
- You will calculate eta square's effect size using the Excel output information as listed in Abbott (2017) Chapter 9: SPSS Procedures with One-Way ANOVA.
- You will perform a post hoc analysis using Tukey Range test. See Abbott (2017) Chapter 9: Figure 9.16.
- You will create a bar graph displaying the 3 or 4 groups you chose as listed Abbott (2017) Chapter 9: Figure 9.13.
Copy and paste into the information you have generated in the statistical findings assignment for Week 7 into the "Final Project" document you submitted in the introduction assignment in Week 6. The goal is that all three parts of the final project will flow within one document. Once you have copied in the relevant information outlined in the instructions above for Week 7, upload the new, more completed version of the "Final Project" into the Final Project in Week 7 - Statistical Analysis column for assignments in Blackboard.
Step by Step Solution
There are 3 Steps involved in it
Step: 1

Get Instant Access to Expert-Tailored Solutions
See step-by-step solutions with expert insights and AI powered tools for academic success
Step: 2

Step: 3
Ace Your Homework with AI
Get the answers you need in no time with our AI-driven, step-by-step assistance
Get Started
Precalculus
Authors: Michael Sullivan
9th edition
321716835, 321716833, 978-0321716835