

Answered step by step
Verified Expert Solution
Question
1 Approved Answer
this is the full question, there's no addition to the question MORGAN STANLEY Equity EQRV -Related Functions Menu Message CO 2 MS US $ 1
this is the full question, there's no addition to the question 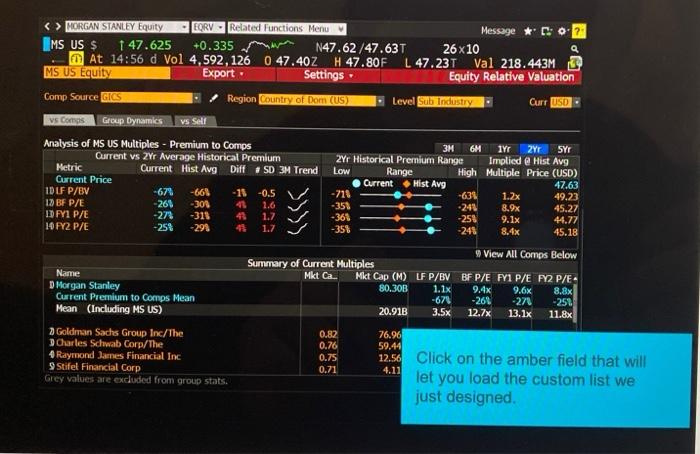
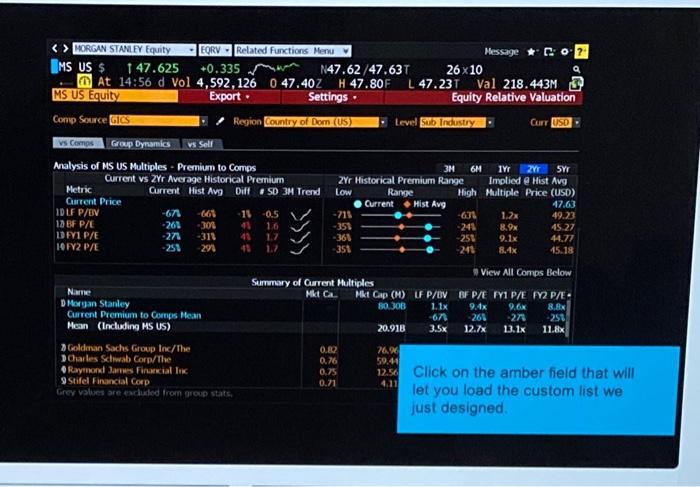
MORGAN STANLEY Equity EQRV -Related Functions Menu Message CO 2 MS US $ 1 47.625 +0.335 mm N47.62/47.637 26x10 q At 14:56 d Vol 4,592, 126 0 47.40Z H 47.80F L 47.231 Val 218.443M 3 NS US Equity Export Settings Equity Relative Valuation Comp Source GIS Region County of Dom (US) Level Industry Curr USO vs Comps Grup Dynamics Analysis of MS US Multiples - Premium to Comps 3M 6H TY 2Y SYT Current vs ZYr Average Historical Premium ZYr Historical Premium Range Implied @ Hist Avg Metric Current Mist Avg Diff SD 3M Trend Low Range High Multiple Price (USD) Current Price Current Hist Avg 47.63 IDLF P/BV -67 -661 11 -0.5 -711 -631 1.2x 49.23 12 BF P/E -261 -306 1.6 -351 -241 8.9x 45.27 1 F1 P/E -27 -311 43 1.7 251 9.1x 44.77 19 FY2 P/E -251 29 17 -351 241 8.4x 15.18 View All Comps Below Surnary of Current Multiples Mkt Ca Mkt Cap (0) IFP/UVBFP/E FY1 P/E FY2P/E- 80.308 1.1x 9.4x 9.6% 8.8% -67 -26% -27 -25% 20.918 3.5x 12.7 13.1x 11.8x Name D Morgan Stanley Current Premium to Comps Mean Mean (Including MS US) Goldman Sachs Group Inc/The Charles Schwab Corp/The Raymond James Financial Inc 9 Stifel Financial Corp Grey values are excluded from group stats 76.90 59.40 0.82 0.76 0.75 0.71 4.11 12.50 Click on the amber field that will let you load the custom list we just designed MORGAN STANLEY Equity EORV - Related Functions Menu Message * Co2 MS US $ 147.625 +0.335 N47.62/47.63T 26 x 10 At 14:56 d Vol 4,592, 126 0 47.402 H 47.80F L 47.237 Val 218.443M MS US Equity Export Settings Equity Relative Valuation Comp Source GTS Region Country of Dom (US) Level Sub Industry Curr USD vs Cons Group Dynamics vs Sell Analysis of MS US Multiples - Premium to Comps 3M 6M 1Yr ZYr SYr Current vs 29 Average Historical Premium 2Yr Historical Premium Range Implied @ Hist Avg Metric Current Hist Avg DiffSD 3M Trend Low Range High Multiple Price (USD) Current Price Current Mist Avg 47.63 IDUF P/BV -674 -661 -0.5 -714 -631 49.23 12) BF P/E -261 -301 43 1.6 -35% .242 8.9x 45.27 ID FY1 P/E -273 -311 43 1.7 -361 -25% 9.1x 44.77 14 FY2 P/E -25% 1.7 -35% -24% .4x 45.18 1.2x 9 View All Comps Below Summary of Current Multiples Mkt Ca. Mkt Cap (M) LF P/BV BF P/E FY1 P/E FY2 P/E- 80.30B 1.1% 8.8x -67 -26% -271 -250 20.91B 3.5x 12.7x 13.1x 11.8% 9.4% 9.6% Name D Morgan Stanley Current Premium to Comps Mean Mean (including MS US) Goldman Sachs Group Inc/The Charles Schwab Corp/The 4 Raymond James Financial Inc Stifel Financial Corp Grey values are excluded from group stats. 0.82 0.76 0.75 0.71 76.96 59.44 12.56 Click on the amber field that will 4.11 let you load the custom list we just designed MORGAN STANLEY Equity EQRV -Related Functions Menu Message CO 2 MS US $ 1 47.625 +0.335 mm N47.62/47.637 26x10 q At 14:56 d Vol 4,592, 126 0 47.40Z H 47.80F L 47.231 Val 218.443M 3 NS US Equity Export Settings Equity Relative Valuation Comp Source GIS Region County of Dom (US) Level Industry Curr USO vs Comps Grup Dynamics Analysis of MS US Multiples - Premium to Comps 3M 6H TY 2Y SYT Current vs ZYr Average Historical Premium ZYr Historical Premium Range Implied @ Hist Avg Metric Current Mist Avg Diff SD 3M Trend Low Range High Multiple Price (USD) Current Price Current Hist Avg 47.63 IDLF P/BV -67 -661 11 -0.5 -711 -631 1.2x 49.23 12 BF P/E -261 -306 1.6 -351 -241 8.9x 45.27 1 F1 P/E -27 -311 43 1.7 251 9.1x 44.77 19 FY2 P/E -251 29 17 -351 241 8.4x 15.18 View All Comps Below Surnary of Current Multiples Mkt Ca Mkt Cap (0) IFP/UVBFP/E FY1 P/E FY2P/E- 80.308 1.1x 9.4x 9.6% 8.8% -67 -26% -27 -25% 20.918 3.5x 12.7 13.1x 11.8x Name D Morgan Stanley Current Premium to Comps Mean Mean (Including MS US) Goldman Sachs Group Inc/The Charles Schwab Corp/The Raymond James Financial Inc 9 Stifel Financial Corp Grey values are excluded from group stats 76.90 59.40 0.82 0.76 0.75 0.71 4.11 12.50 Click on the amber field that will let you load the custom list we just designed MORGAN STANLEY Equity EORV - Related Functions Menu Message * Co2 MS US $ 147.625 +0.335 N47.62/47.63T 26 x 10 At 14:56 d Vol 4,592, 126 0 47.402 H 47.80F L 47.237 Val 218.443M MS US Equity Export Settings Equity Relative Valuation Comp Source GTS Region Country of Dom (US) Level Sub Industry Curr USD vs Cons Group Dynamics vs Sell Analysis of MS US Multiples - Premium to Comps 3M 6M 1Yr ZYr SYr Current vs 29 Average Historical Premium 2Yr Historical Premium Range Implied @ Hist Avg Metric Current Hist Avg DiffSD 3M Trend Low Range High Multiple Price (USD) Current Price Current Mist Avg 47.63 IDUF P/BV -674 -661 -0.5 -714 -631 49.23 12) BF P/E -261 -301 43 1.6 -35% .242 8.9x 45.27 ID FY1 P/E -273 -311 43 1.7 -361 -25% 9.1x 44.77 14 FY2 P/E -25% 1.7 -35% -24% .4x 45.18 1.2x 9 View All Comps Below Summary of Current Multiples Mkt Ca. Mkt Cap (M) LF P/BV BF P/E FY1 P/E FY2 P/E- 80.30B 1.1% 8.8x -67 -26% -271 -250 20.91B 3.5x 12.7x 13.1x 11.8% 9.4% 9.6% Name D Morgan Stanley Current Premium to Comps Mean Mean (including MS US) Goldman Sachs Group Inc/The Charles Schwab Corp/The 4 Raymond James Financial Inc Stifel Financial Corp Grey values are excluded from group stats. 0.82 0.76 0.75 0.71 76.96 59.44 12.56 Click on the amber field that will 4.11 let you load the custom list we just designed Step by Step Solution
There are 3 Steps involved in it
Step: 1

Get Instant Access to Expert-Tailored Solutions
See step-by-step solutions with expert insights and AI powered tools for academic success
Step: 2

Step: 3
Ace Your Homework with AI
Get the answers you need in no time with our AI-driven, step-by-step assistance
Get Started
Compliance Audits And Plans For Healthcare
Authors: Cherilyn G. Murer, Michael A. Murer, Lyndean Lenhoff Brick, Healthcare Financial Management Association (U. S.)
1st Edition
0070444625, 978-0070444621