Answered step by step
Verified Expert Solution
Link Copied!

Question

1 Approved Answer

This is the graph I was given 8) Given the following Calculate a) the Min, Max, Mean, Median, and Standard Deviation and b) calculate the

This is the graph I was given
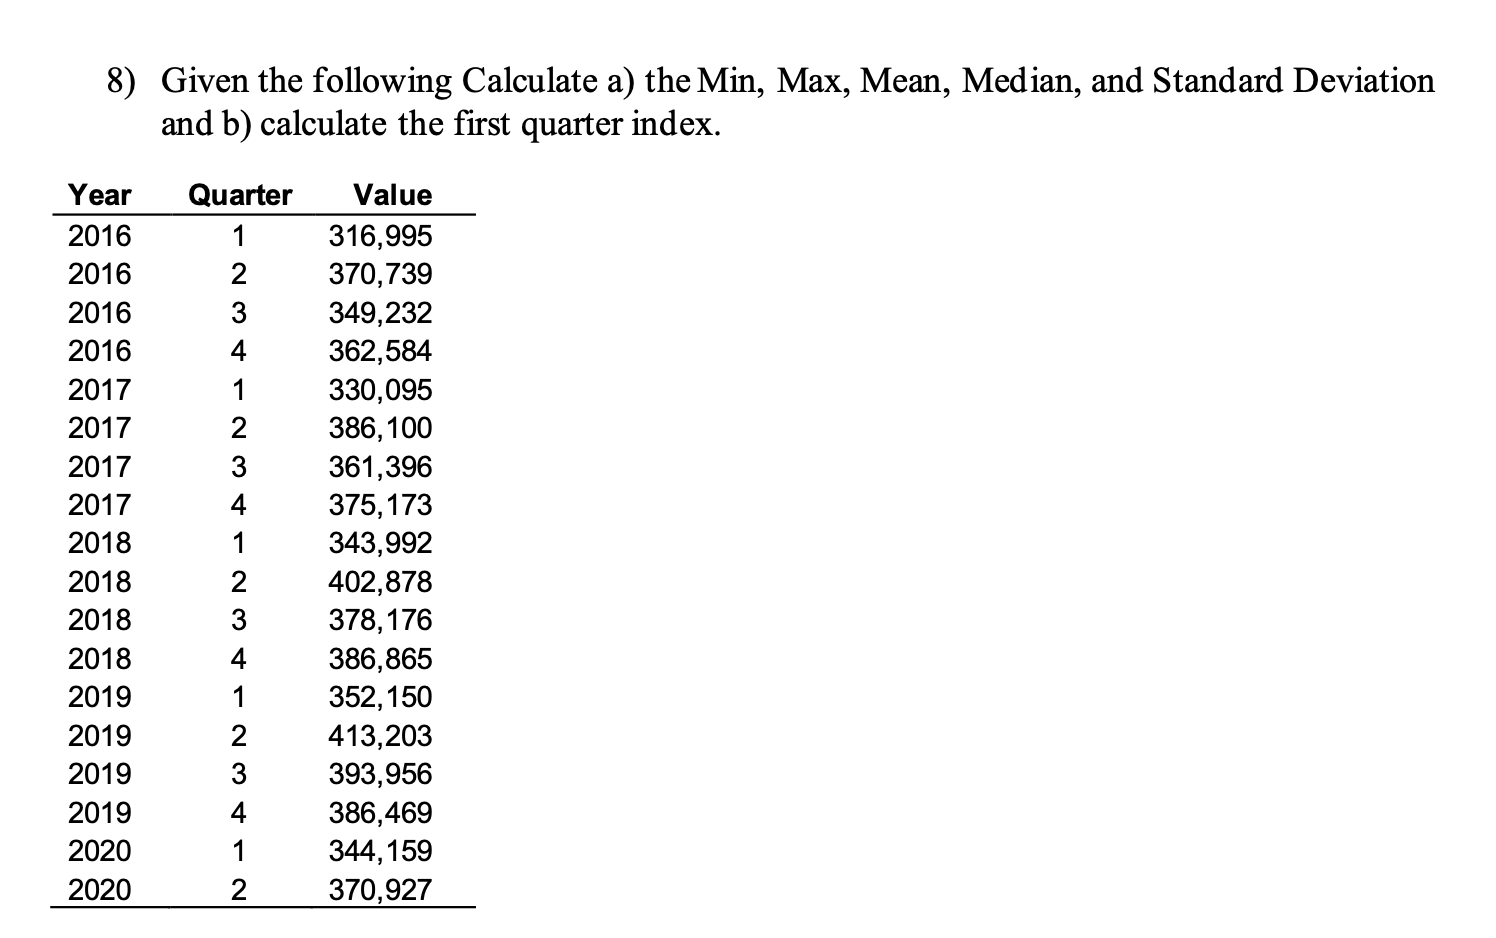
image text in transcribed
8) Given the following Calculate a) the Min, Max, Mean, Median, and Standard Deviation and b) calculate the rst quarter index. Year Quarter Value 2016 1 316,995 2016 2 370,739 2016 3 349,232 2016 4 362,584 2017 1 330,095 2017 2 386,100 2017 3 361 .396 2017 4 375,173 2018 1 343.992 2018 2 402,878 2018 3 378,176 2018 4 386.865 2019 1 352,150 2019 2 413,203 2019 3 393,956 2019 4 386,469 2020 1 344,159 2020 2 370,927

Step by Step Solution

There are 3 Steps involved in it

Step: 1

blur-text-image

Get Instant Access to Expert-Tailored Solutions

See step-by-step solutions with expert insights and AI powered tools for academic success

Step: 2

blur-text-image

Step: 3

blur-text-image

Ace Your Homework with AI

Get the answers you need in no time with our AI-driven, step-by-step assistance

Get Started

Recommended Textbook for

Strategic Management And Business Policy Toward Global Sustainability

Authors: Thomas L. Wheelen, J. David Hunger

13th Edition

9780132998079, 132998076, 978-0132153225

More Books

Students also viewed these Economics questions