Answered step by step
Verified Expert Solution
Question
1 Approved Answer
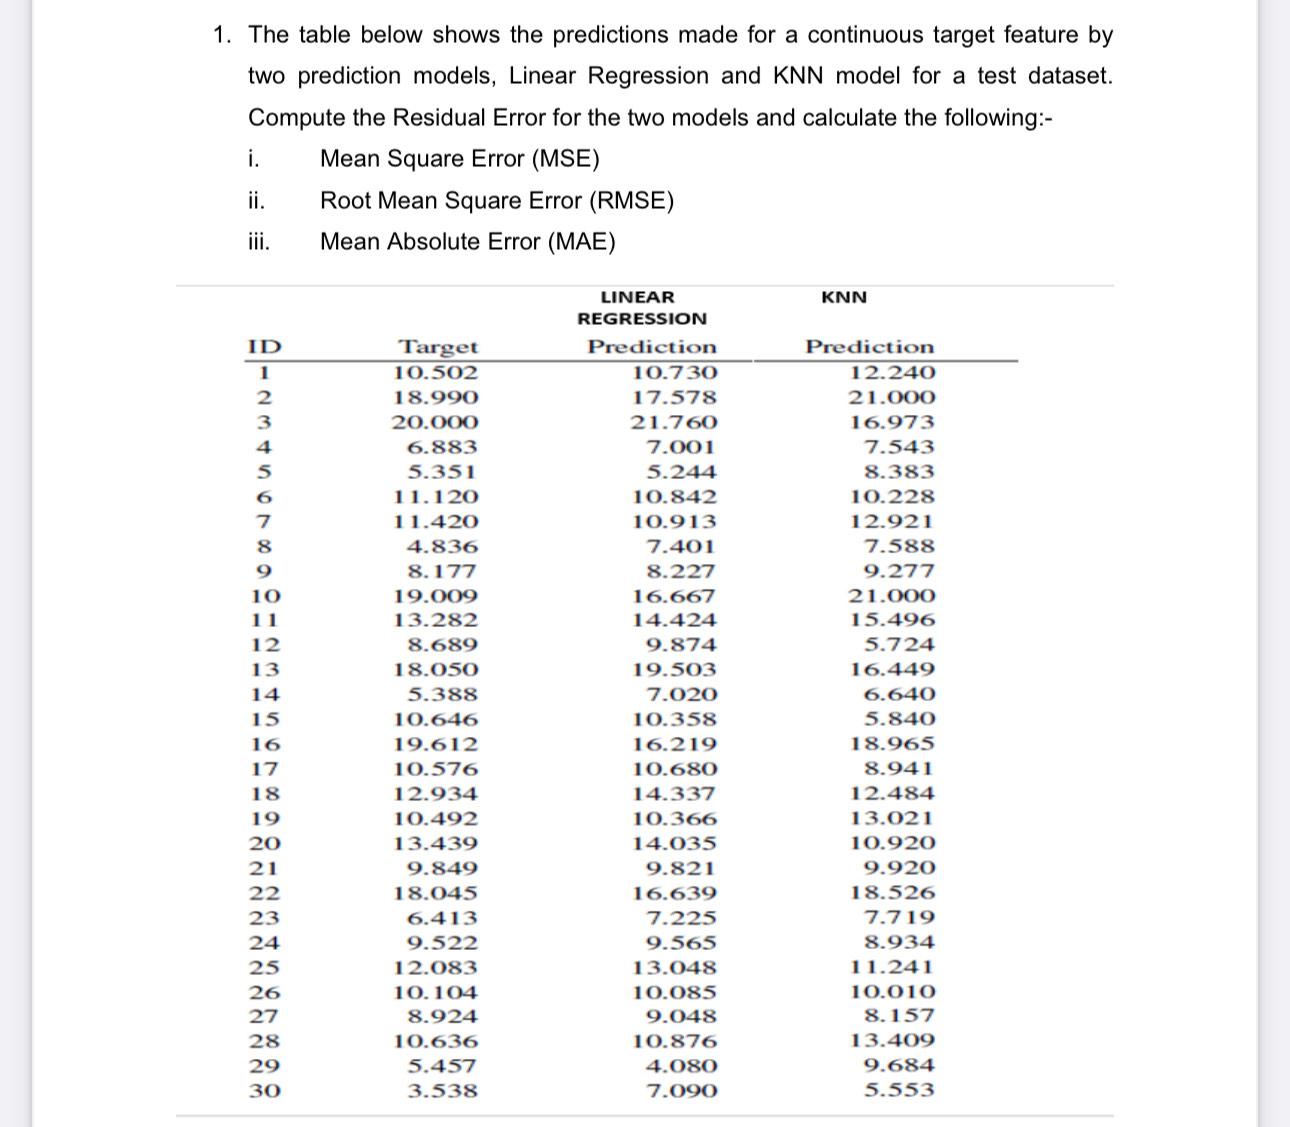
n 1. The table below shows the predictions made for a continuous target feature by two prediction models, Linear Regression and KNN model for a
 n
n
1. The table below shows the predictions made for a continuous target feature by two prediction models, Linear Regression and KNN model for a test dataset. Compute the Residual Error for the two models and calculate the following:- Mean Square Error (MSE) Root Mean Square Error (RMSE) Mean Absolute Error (MAE) i. ii. 21234567 ID 10 11 12 13 14 15 16 17 18 19 20 21 22 23 24 25 26 27 28 29 30 Target 10.502 18.990 20.000 6.883 5.351 11.120 11.420 4.836 8.177 19.009 13.282 8.689 18.050 5.388 10.646 19.612 10.576 12.934 10.492 13.439 9.849 18.045 6.413 9.522 12.083 10.104 8.924 10.636 5.457 3.538 LINEAR REGRESSION Prediction 10.730 17.578 21.760 7.001 5.244 10.842 10.913 7.401 8.227 16.667 14.424 9.874 19.503 7.020 10.358 16.219 10.680 14.337 10.366 14.035 9.821 16.639 7.225 9.565 13.048 10.085 9.048 10.876 4.080 7.090 KNN Prediction 12.240 21.000 16.973 7.543 8.383 10.228 12.921 7.588 9.277 21.000 15.496 5.724 16.449 6.640 5.840 18.965 8.941 12.484 13.021 10.920 9.920 18.526 7.719 8.934 11.241 10.010 8.157 13.409 9.684 5.553
Step by Step Solution
★★★★★
3.51 Rating (158 Votes )
There are 3 Steps involved in it
Step: 1
To compute the residual errors for the two models Linear Regression and KNN you need to calculate the differences between the actual target values and ...
Get Instant Access to Expert-Tailored Solutions
See step-by-step solutions with expert insights and AI powered tools for academic success
Step: 2

Step: 3

Ace Your Homework with AI
Get the answers you need in no time with our AI-driven, step-by-step assistance
Get Started


