Answered step by step
Verified Expert Solution
Question
1 Approved Answer
this is the total data you have to use: https://docs.google.com/spreadsheets/d/e/2PACX-1vRVwA-2F-o6FAxPg960ISQGGPg7PFGMYjalkKufK5em4yq8bHvZhtXkKbjZJnORbw/pubhtml Total of 1200 cells were collected from 3 tissues. Expression of 10 genes in these

this is the total data you have to use:
https://docs.google.com/spreadsheets/d/e/2PACX-1vRVwA-2F-o6FAxPg960ISQGGPg7PFGMYjalkKufK5em4yq8bHvZhtXkKbjZJnORbw/pubhtml
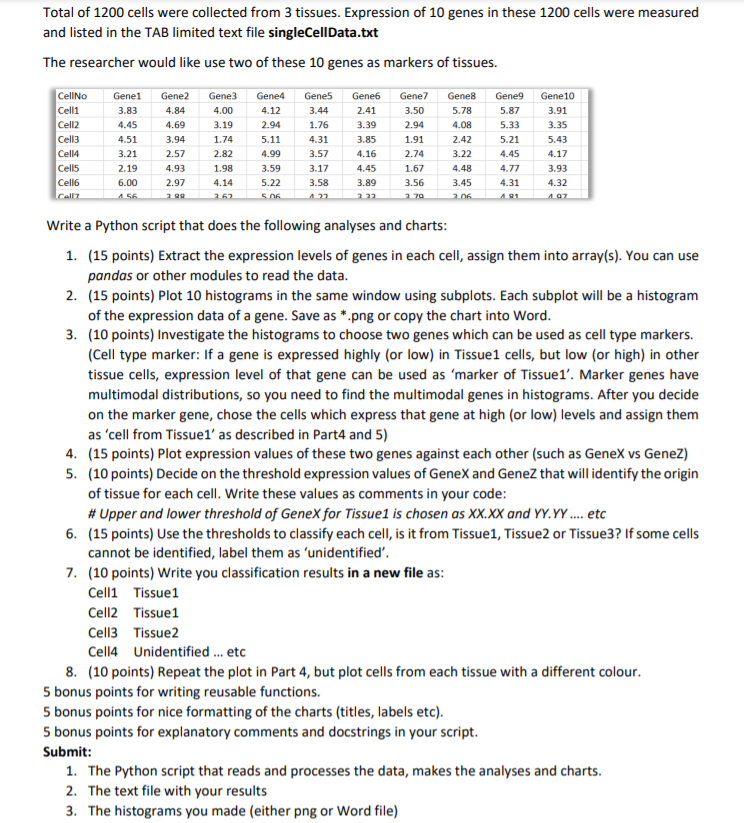
Total of 1200 cells were collected from 3 tissues. Expression of 10 genes in these 1200 cells were measured and listed in the TAB limited text file singleCellData.txt The researcher would like use two of these 10 genes as markers of tissues. Gene7 3.50 Gene8 5.78 2.94 4.08 CellNo Celli Cell2 Cells Cell Cells Cell6 Call Gene1 3.83 4.45 4.51 3.21 2.19 6.00 1.56 Gene2 4.84 4.69 3.94 2.57 4.93 2.97 2.99 Gene3 4.00 3.19 1.74 2.82 1.98 4.14 2.62 Gene4 4.12 2.94 5.11 4.99 3.59 5.22 5.06 Gene5 3.44 1.76 4.31 3.57 3.17 3.58 172 Gene6 2.41 3.39 3.85 4.16 4.45 3.89 222 1.91 2.74 1.67 3.56 2.42 3.22 4.48 3.45 2.06 Gene9 5.87 5.33 5.21 4.45 4.77 4.31 1921 Gene10 3.91 3.35 5.43 4.17 3.93 4.32 107 2.70 Write a Python script that does the following analyses and charts: 1. (15 points) Extract the expression levels of genes in each cell, assign them into array(s). You can use pandas or other modules to read the data. 2. (15 points) Plot 10 histograms in the same window using subplots. Each subplot will be a histogram of the expression data of a gene. Save as *.png or copy the chart into Word. 3. (10 points) Investigate the histograms to choose two genes which can be used as cell type markers. (Cell type marker: If a gene is expressed highly (or low) in Tissue1 cells, but low (or high) in other tissue cells, expression level of that gene can be used as 'marker of Tissue1'. Marker genes have multimodal distributions, so you need to find the multimodal genes in histograms. After you decide on the marker gene, chose the cells which express that gene at high (or low) levels and assign them as 'cell from Tissuel' as described in Part4 and 5) 4. (15 points) Plot expression values of these two genes against each other (such as GeneX vs Genez) 5. (10 points) Decide on the threshold expression values of GeneX and GeneZ that will identify the origin of tissue for each cell. Write these values as comments in your code: # Upper and lower threshold of GeneX for Tissue1 is chosen as XX.XX and YY.YY.... etc 6. (15 points) Use the thresholds to classify each cell, is it from Tissue1, Tissue2 or Tissue3? If some cells cannot be identified, label them as 'unidentified'. 7. (10 points) Write you classification results in a new file as: Cell1 Tissue1 Cell2 Tissue1 Cell3 Tissue 2 Celly Unidentified ...etc 8. (10 points) Repeat the plot in Part 4, but plot cells from each tissue with a different colour. 5 bonus points for writing reusable functions. 5 bonus points for nice formatting of the charts (titles, labels etc). 5 bonus points for explanatory comments and docstrings in your script. Submit: 1. The Python script that reads and processes the data, makes the analyses and charts. 2. The text file with your results 3. The histograms you made (either png or Word file)
Step by Step Solution
There are 3 Steps involved in it
Step: 1

Get Instant Access to Expert-Tailored Solutions
See step-by-step solutions with expert insights and AI powered tools for academic success
Step: 2

Step: 3

Ace Your Homework with AI
Get the answers you need in no time with our AI-driven, step-by-step assistance
Get Started


