This is to be done in the software R. Please show all the codes used.


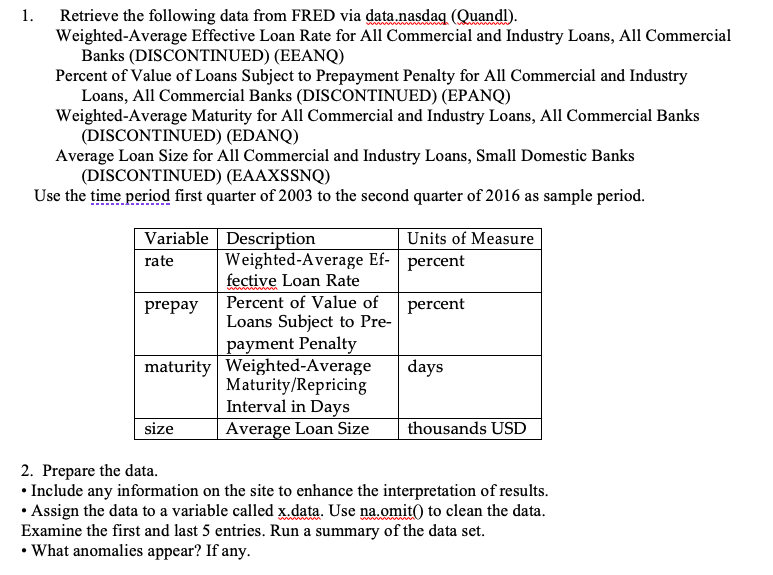
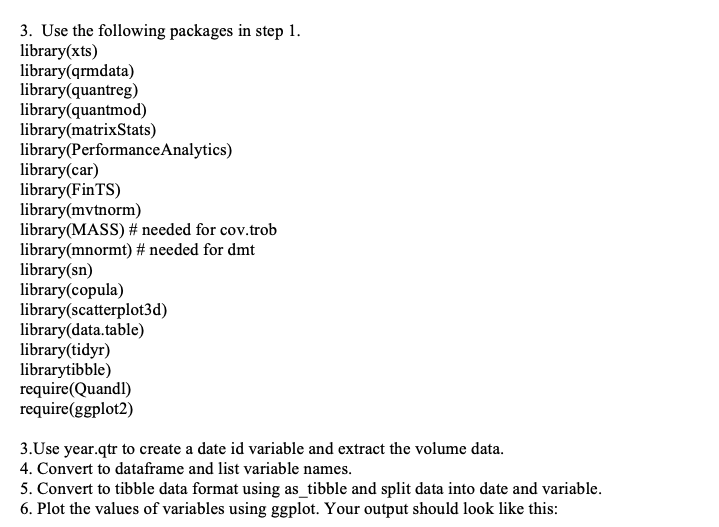
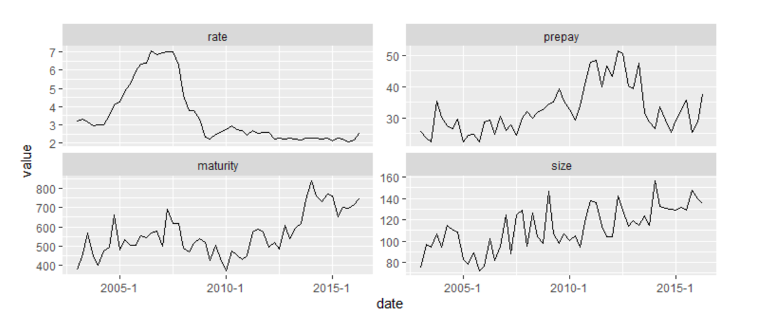
1. Retrieve the following data from FRED via data.nasdaq (Quandl). Weighted-Average Effective Loan Rate for All Commercial and Industry Loans, All Commercial Banks (DISCONTINUED) (EEANQ) Percent of Value of Loans Subject to Prepayment Penalty for All Commercial and Industry Loans, All Commercial Banks (DISCONTINUED) (EPANQ) Weighted-Average Maturity for All Commercial and Industry Loans, All Commercial Banks (DISCONTINUED) (EDANQ) Average Loan Size for All Commercial and Industry Loans, Small Domestic Banks (DISCONTINUED) (EAAXSSNQ) Use the time period first quarter of 2003 to the second quarter of 2016 as sample period. Variable Description Units of Measure rate Weighted Average Ef-percent fective Loan Rate prepay Percent of Value of percent Loans Subject to Pre- payment Penalty maturity Weighted-Average days Maturity/Repricing Interval in Days Average Loan Size thousands USD size 2. Prepare the data. Include any information on the site to enhance the interpretation of results. Assign the data to a variable called x.data. Use na.omit() to clean the data. Examine the first and last 5 entries. Run a summary of the data set. What anomalies appear? If any. 3. Use the following packages in step 1. library(xts) library(qrmdata) library(quantreg) library(quantmod) library(matrixStats) library(Performance Analytics) library(car) library(FinTS) library(mytnorm) library(MASS) # needed for cov.trob library(mnormt) # needed for dmt library(sn) library(copula) library(scatterplot3d) library(data.table) library(tidyr) librarytibble) require(Quandl) require(ggplot2) 3.Use year.qtr to create a date id variable and extract the volume data. 4. Convert to dataframe and list variable names. 5. Convert to tibble data format using as_tibble and split data into date and variable. 6. Plot the values of variables using ggplot. Your output should look like this: rate prepay 7 6 50 - 40- 5 - 4- 3- 2- w , 30- N value maturity size 160- 140- 800- 700- 600 - 500 - 400- Mamma ", . 120 - sharunas minha who 100 - 80- 2005-1 2010-1 2015-1 2005-1 2010-1 2015-1 date 1. Retrieve the following data from FRED via data.nasdaq (Quandl). Weighted-Average Effective Loan Rate for All Commercial and Industry Loans, All Commercial Banks (DISCONTINUED) (EEANQ) Percent of Value of Loans Subject to Prepayment Penalty for All Commercial and Industry Loans, All Commercial Banks (DISCONTINUED) (EPANQ) Weighted-Average Maturity for All Commercial and Industry Loans, All Commercial Banks (DISCONTINUED) (EDANQ) Average Loan Size for All Commercial and Industry Loans, Small Domestic Banks (DISCONTINUED) (EAAXSSNQ) Use the time period first quarter of 2003 to the second quarter of 2016 as sample period. Variable Description Units of Measure rate Weighted Average Ef-percent fective Loan Rate prepay Percent of Value of percent Loans Subject to Pre- payment Penalty maturity Weighted-Average days Maturity/Repricing Interval in Days Average Loan Size thousands USD size 2. Prepare the data. Include any information on the site to enhance the interpretation of results. Assign the data to a variable called x.data. Use na.omit() to clean the data. Examine the first and last 5 entries. Run a summary of the data set. What anomalies appear? If any. 3. Use the following packages in step 1. library(xts) library(qrmdata) library(quantreg) library(quantmod) library(matrixStats) library(Performance Analytics) library(car) library(FinTS) library(mytnorm) library(MASS) # needed for cov.trob library(mnormt) # needed for dmt library(sn) library(copula) library(scatterplot3d) library(data.table) library(tidyr) librarytibble) require(Quandl) require(ggplot2) 3.Use year.qtr to create a date id variable and extract the volume data. 4. Convert to dataframe and list variable names. 5. Convert to tibble data format using as_tibble and split data into date and variable. 6. Plot the values of variables using ggplot. Your output should look like this: rate prepay 7 6 50 - 40- 5 - 4- 3- 2- w , 30- N value maturity size 160- 140- 800- 700- 600 - 500 - 400- Mamma ", . 120 - sharunas minha who 100 - 80- 2005-1 2010-1 2015-1 2005-1 2010-1 2015-1 date


