Answered step by step
Verified Expert Solution
Question
1 Approved Answer
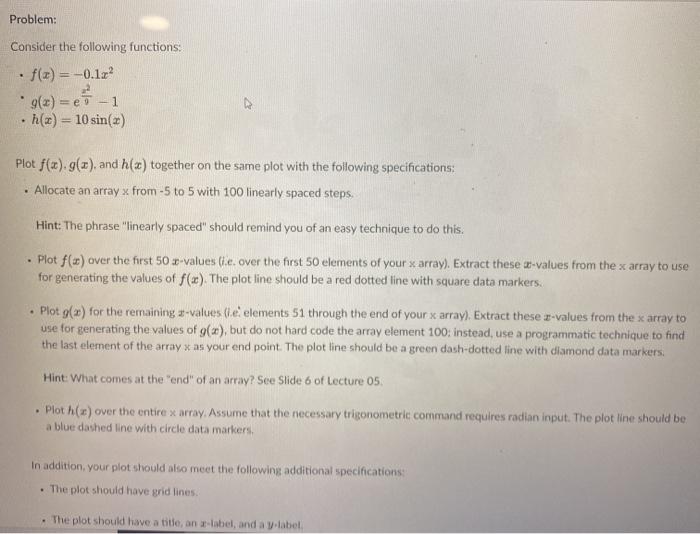
this is using MATLAB Problem: Consider the following functions: . f(x) = -0.1.2? g(x) = -1 h(x) = 10 sin() . Plot f(x) g(w)and h(x)


this is using MATLAB
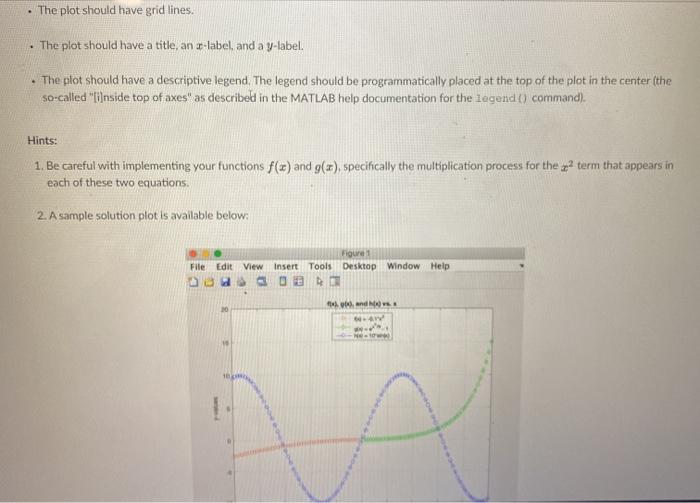
Problem: Consider the following functions: . f(x) = -0.1.2? g(x) = -1 h(x) = 10 sin() . Plot f(x) g(w)and h(x) together on the same plot with the following specifications: Allocate an array x from -5 to 5 with 100 linearly spaced steps. Hint: The phrase "linearly spaced" should remind you of an easy technique to do this. . Plot f(a) over the first 50 3-values (ie over the first 50 elements of your x array). Extract these values from the x array to use for generating the values of f(x). The plot line should be a red dotted line with square data markers. Plot g(x) for the remaining 3-values (le elements 51 through the end of your x array). Extract these 2-values from the x array to Use for generating the values of g(x), but do not hard code the array element 100: instead, use a programmatic technique to find the last element of the array x as your end point. The plot line should be a green dash-dotted line with diamond data markers, Hint: What comes at the end of an array? See Slide 6 of Lecture 05 . Plot h(x) over the entire xarray. Assume that the necessary trigonometric command requires radian input. The plot line should be a blue dashed line with circle data markers In addition, your plot should also meet the following additional specifications . The plot should have grid lines The plot should have a title, anar-label, and a label The plot should have grid lines. The plot should have a title, an at-labeland a y-label. The plot should have a descriptive legend. The legend should be programmatically placed at the top of the plot in the center (the so-called "lilnside top of axes" as described in the MATLAB help documentation for the legend ) command). Hints: 1. Be careful with implementing your functions f(c) and g(x), specifically the multiplication process for the term that appears in each of these two equations 2. A sample solution plot is available below: Figure 1 File Edit View Insert Tools Desktop Window Help GO and Step by Step Solution
There are 3 Steps involved in it
Step: 1

Get Instant Access to Expert-Tailored Solutions
See step-by-step solutions with expert insights and AI powered tools for academic success
Step: 2

Step: 3

Ace Your Homework with AI
Get the answers you need in no time with our AI-driven, step-by-step assistance
Get Started


