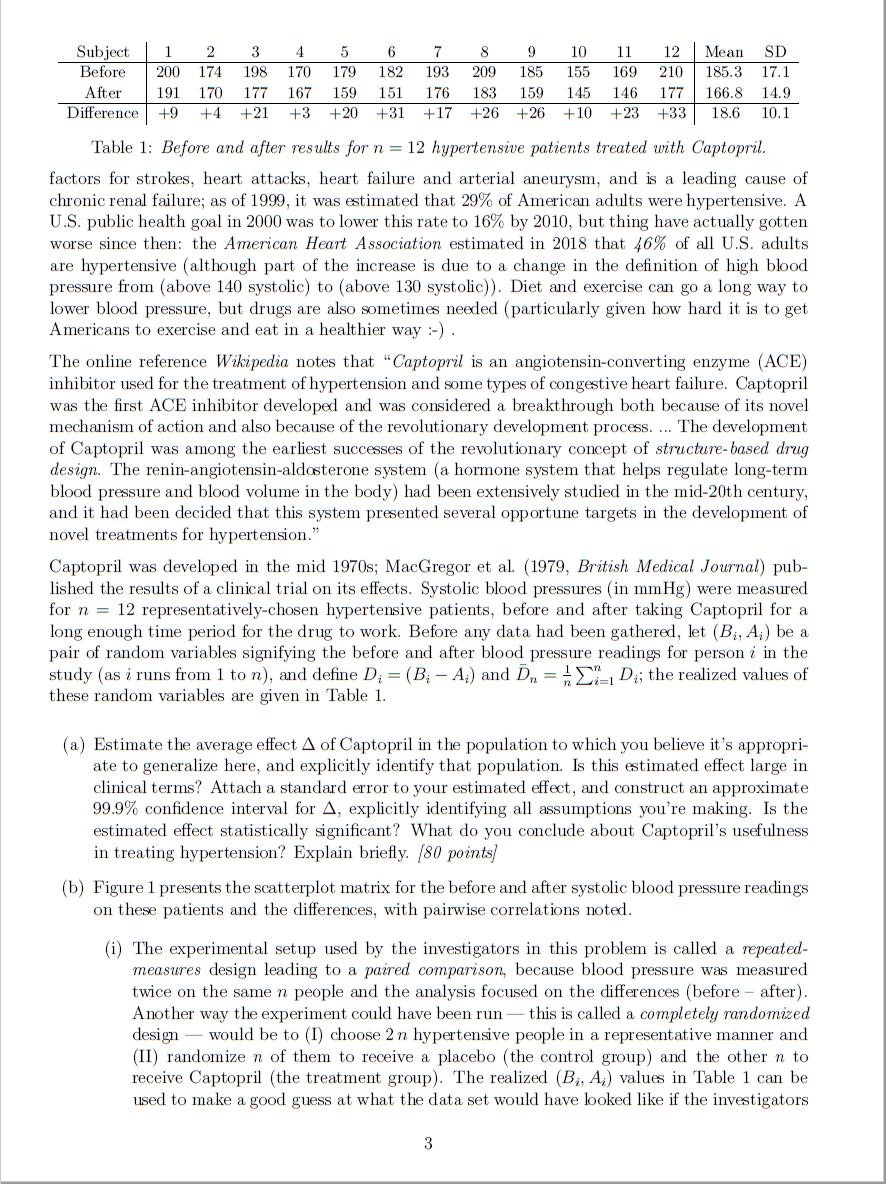
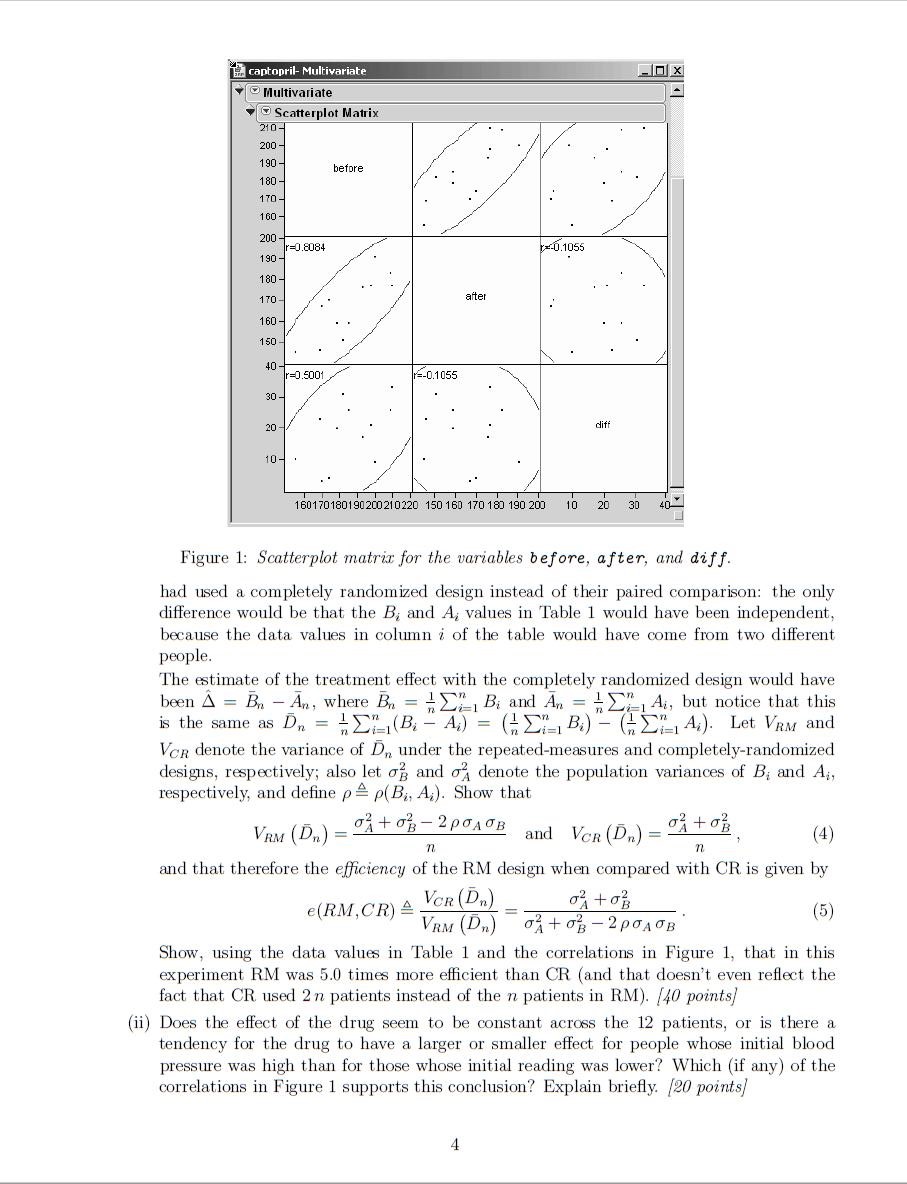
This model requires an act of imagination to formulate, because the model breaks the only thing we get to observe (the number on the left side of the equation) into the sum of three things we can't observe; you may therefore wonder about its usefulness, but (as we'll see) it's actually quite helpful. Let 0 stand for the true value of the thing being measured (in this problem, 0 is the true pl of the lake); let b stand for the bias in the measurement process; and let the e, be the random measurement errors. Then symbolically equation (1) looks like this: Yi = 0+btel Yn = Otbten. (2) In the standard measurement error model, the er are regarded as IID random variables (this assump- tion is only reasonable if (i) the measurements are performed in a logically independent manner and (ii) we try hard to ensure that each observation is performed in precisely the same way) with mean 0 (any mean other than 0 gets absorbed into the bias term) and finite standard deviation o. Define EL, Y, and en = = Zer. (a) Show that Yn = 0 + b + en; show that V(e,) = ~; and therefore show that E(Y,) = 0 + b and V()n) = ". Intuitively, why is the variance of en smaller than the variance of any of the e; going into en? Show that your results in this part of the problem imply that Y', only converges in probability to the truth 0 if b = 0. Show that the typical amount RMSE( Y,) = VE [(Y, - 0)2 by which Y, is likely to differ from 0 (RMSE stands for root mean squared error) is given by the Pythagorean expression RMSE (Y,) = - + 62 , (3) and that therefore this also only goes to 0 as more data accumulates if b = 0. /80 points) Suppose for the rest of this problem that the true pl of this lake is 5.1, so that in fact it's not actually threatened. (b) If you take only a single water sample and process it with your pl kit, what's the probability that you'll incorrectly conclude that this lake is threatened? Show your work. (10 points) (c) You're not happy with the misclassification probability in (b), and you decide to remedy this by taking n > 1 independent water samples from the lake and basing your assessment on their mean pl value Y. How large does n need to be to make the probability of fincorrectly concluding that this lake is threatened} 0.5% or less? Be explicit about all aspects of your probability model, including all of the assumptions you make and whether you think they're reasonable. (40 points 2. /140 total points) ( medicine) Hypertension is a medical condition in which a person's blood pressure is chronically elevated. (A reminder: blood pressure is measured with two numbers called systolic (higher) and diastolic (lower), in a deeply anachronistic scale called mmHg (millimeters of mercury); blood pressures are stored as data in the form "systolic over diastolic" i.e., 115 over 75 or 115/75; and ideal blood pressures range from 90/60 to 120/80.) Persistent hypertension is one of the riskSubject 1 2 3 .1 5 5 r 3 9 15 11 12 Mam so Before 299 174 193 179 179 132 193 299 135 155 159 219 135.3 17.1 A1151 191 179 11'? 151' 159 151 115 153 159 145 145 11'? 155.3 14.9 [11911151155 +9 +1. +21 +3 +29 +31 +17 +25 +25 +19 +23 +33 13.5 19.1 Table 1: Before and after results for n = 12 hypertensive patients treated with Captopril. factors for strokes, heart attacks, heart failure and arterial aneurysm, and is a leading cause of chronic renal failure; as of 1999, it was estimated that 29% of American adults were hypertensive. A US. public health goal in 2999 was to lower this rate to 16% by 2919, but thing have actually gotten worse since then: the American Heart Association estimated in 2918 that 46% of all U.S. adults are hypertensive (although part of the increase is due to a change in the denition of high blood pressure from (above 149 systolic) to (above 139 systolicD. Diet and exercise can go a long way to lower blood pressure, but drugs are also sometimes nestled {particularly given how hard it is to get Americans to exercise and eat in a healthier way :-) . The online reference Wilcipedia notes that \"Captopril is an angiotensinconverting enzyme {ACE} inhibitor used for the treatment of hypertension and some types of oongeative heart failure. Captopril was the rst ACE inhibitor developed and was considered a breakthrough both because of its novel mechanism of action and also because of the revolutionary development process. The development of Captopril was among the earliest successes of the revolutionary concept of structure-based drug design. The reninangiotensinaldcsterone system (a hormone system that helps regulate long-term blood pressure and blood volume in the body) had been extensively studied in the mid-20th century, and it had been decided that this system presented several opportune targets in the development of novel treatments for hypertension}1 Captopril was developed in the mid 1979s; MacGregor et a1 (1979, British Medical Journal) pub- lished the results of a clinical trial on its edects. Systolic blood pressures (in romHg) were measured for n = 12 representatively-chosen hypertensive patients, before and after taking Captopril for a long enough time period for the drug to work. Before any data had been gathered, let (3,, 14,-) be a. pair of random variables signifying the before and after blood pressure readings fer." person i in the study (as irons horn 1 to n), and dene D, = (B, 14,) and 3,, = gg 10,; the realized values of these random variables are given in Table 1. {a} Estimate the average effect A of Captopril in the population to which you believe it's appropri- ate to generalize here, and explicitly identify that population Is this estimated effect large in clinical terms? Attach a standard error to your estimated edect, and construct an approximate 99.9% condence interval for it, explicitly identifying all assumptions you're making. Is the estimated ell'ect statistically signicant? What do you conclude about Captopril's usefulness in treating hypertension? Explain briey. {5'9 points}I (b) Figure 1 presents the scatterplot matrix Jfor the before and after systolic blood pressure readings on these patients and the ditferences, with pairwise correlations noted. (1] The experimental setup used by the investigators in this problem is called a repeated- measures design leading to a paired comparison because blood pressure was measured twice on the same it people and the analysis focused on the di'erences (before after}. Another way the experiment could have been run this is called a completely randomized design would be to (I) choose 2 in hypertensive people in a representative manner and {11) randomize n of them to receive a placebo {the control group) and the other 31 to receive Captopril (the treatment group). The realized (Bi, At) mines in Table 1 can be used to make a good guess at what the data set would have looked like if the investigators 3 captopril- Multivariate Multivariate @ Scatterplot Matrix 210- 200 190 before 180 - 170- 160 - 200 r=0.8084 r=-0.1055 190 - 180- 170 after 160 - 150 40 2-0.1055 30 20 diff 10 160170180190200210220 150 160 170 180 190 200 10 20 30 Figure 1: Scatterplot matrix for the variables before, after, and diff. had used a completely randomized design instead of their paired comparison: the only difference would be that the B; and A, values in Table 1 would have been independent, because the data values in column i of the table would have come from two different people. The estimate of the treatment effect with the completely randomized design would have been A = Bn - An, where Be = = 2, Bi and An = = 2,A, but notice that this is the same as D. = EL,(B. - A.) = (Et_, B.) - (HEL, A;). Let VRM and Ver denote the variance of D, under the repeated-measures and completely-randomized designs, respectively; also let or and on denote the population variances of B; and A;, respectively, and define p = p( B;, A;). Show that VRM (DR.) = 4+ OB- 2PACE and VOR (D. ) = tog (4) n n and that therefore the efficiency of the RM design when compared with CR is given by e(RM, CR) A VCR (D..) VRM ( Dn) 03+OB - 2POAUB (5) Show, using the data values in Table 1 and the correlations in Figure 1, that in this experiment RM was 5.0 times more efficient than CR (and that doesn't even reflect the fact that CR used 2n patients instead of the n patients in RM). /40 points/ (ii) Does the effect of the drug seem to be constant across the 12 patients, or is there a tendency for the drug to have a larger or smaller effect for people whose initial blood pressure was high than for those whose initial reading was lower? Which (if any) of the correlations in Figure 1 supports this conclusion? Explain briefly. /20 points)