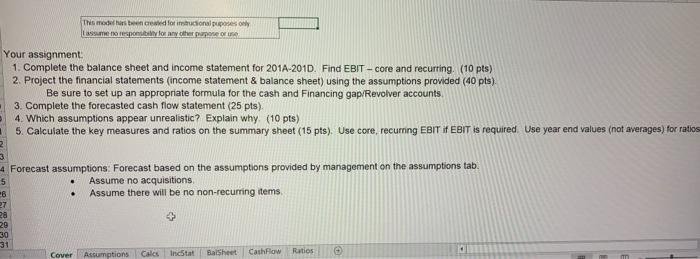
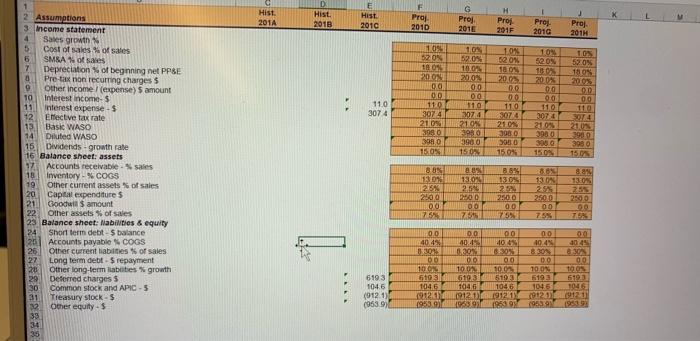
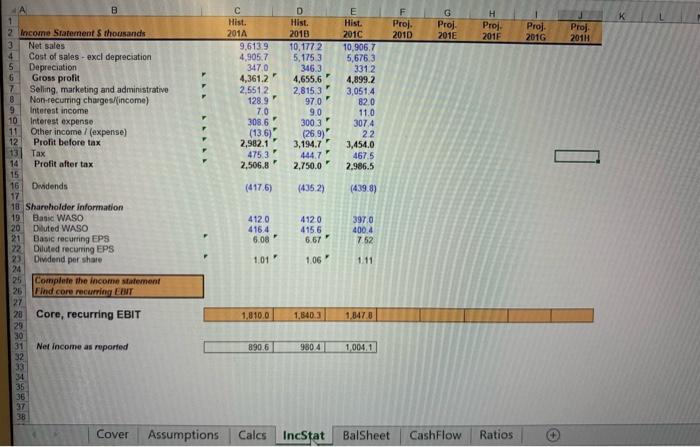
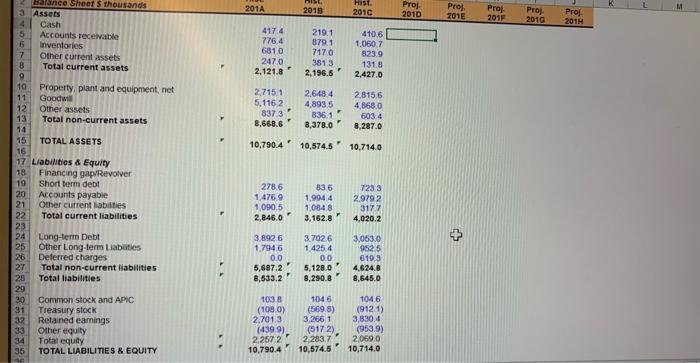
This modern cewed forcional poses only poranye pone Your assignment 1. Complete the balance sheet and income statement for 201A-2010. Find EBIT - core and recurring. (10 pts) 2. Project the financial statements (income statement & balance sheet) using the assumptions provided (40 pts). Be sure to set up an appropriate formula for the cash and Financing gap/Revolver accounts 3. Complete the forecasted cash flow statement (25 pts) 4. Which assumptions appear unrealistic? Explain why (10 pts) 5. Calculate the key measures and ratios on the summary sheet (15 pts). Use core, recurring EBIT if EBIT is required. Use year end values (not averages) for ratios 2 3 4 Forecast assumptions: Forecast based on the assumptions provided by management on the assumptions tab Assume no acquisitions Assume there will be no non-recurring items 27 28 29 30 31 Assumptions Incstat Balsheet Ratios 5 8 . Cover Calc Cashflow IT Hist. 201A D Hist. 2010 E Hist 2010 F Proj 2010 X G Proj 2015 H Proj 291F Proj 2016 Proj 2011 1.03 2015 1.09 520 1001 200 00 00 11,0 3074 210 3980 3980 150 100 62.05 10.02 2009 00 00 119 2074 2108 300 3900 1509 110 307 4 101 52.05. 110 20.0% DO 00 110 2074 21.04 3900 3000 TOS 5205 18.09 200% 90 00 180 20.0 00 00 110 3074 2105 3980 50 15.0% 9900 398 0 150 1 2 Assumptions 3 income statement 4 Sales growth 5 Cost of sales of sales 5 SMEA of Sales 7 Depreciation of beginning net PPSE 0 Pre-ta non recurring charges $ O Other income (expense) 5 amount 10 Interest income 11 Interest expenses 12 Electve tax rate 13 Basic WASO 14 Diluted WASO 15 Dividends - growth rate 16 Balance sheet: assets 12 Accounts receivable-sales 18 Inventory - % COGS 19 Other current sets of sales 20 Capital expenditures 211 Goodwill amount 22 Other assets of sales 23 Balance sheet: Nabilities & equity 24 Short term debt-5 balance 26 Accounts payable SCOGS 26 Other current liabilities of sales 27 Long term debt-repayment 20 Other long-term labities growth 29 Deferred charges 3 30 Common stock and APIC - 5 31 Treasury stock - 5 22 Other equity - 5 33 34 35 888 TON 2.5% 2400 00 25 13:04 2,546 00 00 ZONE 13.04 29 2500 0.0 75% 8.65 13 2513 28.00 13015 255 2500 75% 00 40.4% 00 DO 100 10 1046 1912-11 1953.00 00 40.453 20 00 100 6103 1046 191201 1963 91 00 00 4045 40.4 4045 30% 830 00 00 00 10.07 10.03 12.05 5103 56193 6193 1046 1045 1046 19131 (9120091211 19539639N 195199 6193 104.5 (9121 (9539) B K F Proj 2010 G Proj 2015 H Proj 2015 Proj 2016 Proj 2011 Hist. 201A 9.613.9 4,905.7 3470 4,361.2 2,5512 D Hist. 2013 10,1772 5,1753 346.3 4,655.6 2,815,3 97.0 9.0 3003 (269) 3,194.7" 444.7 2.750.0 E Hist. 2010 10.906.7 5,6763 3312 4,899.2 3,0514 820 11.0 307.4 22 3,454.0 467.5 2.986.5 F 1289 70 308.6 (13.6) 2,982.1 4753 2,506.8 (4176) (4352) (4398) 2 Income Statement thousands 3 Net sales 4 Cast of sales - excl depreciation 5 Depreciation 6 Gross profit 7 Selling, marketing and administrative 8 Non-recurring charges (income) 9 Interest income 10 Interest expense 11 Other income (expense) 12 Prolit before tax 13 Tax 14 Profit after tax 15 16 Dividends 17 18 Shareholder information 19 Basic WASO 20 Diluted WASO 21 Basic recurring EPS 72 Diluted recurring EPS 23 Dividend per share 24 25 Complete the income statement 26 Find core recurring EINT 27 20 Core, recurring EBIT 29 30 31 Net Income as reported 32 33 34 35 36 37 38 4120 416.4 5.08 4120 415.6 6.67 F 3970 400.4 752 1.01 1.06 1.11 1,810.0 1.840 3 1,8478 890.6 9804 1,004,1 Cover Assumptions Calcs IncStat BalSheet Cashflow Ratios 201A 2013 Hist. 2010 Proj 2010 Proj Proj 2015 Proj 2010 Proj 2017 2011 417 4 776.4 6810 2470 219.1 879 1 7170 381.3 2,195.5 4106 10507 8239 131.8 2,427.0 2,121.8" 2,7151 5.1162 837.3 8,668.6' 2.6484 4,893,5 8361 2,815,6 4,868.0 603 4 8.287.0 8,378.0" 10,790.4 10,574.5 10.714.0 lance Sheets thousands 3 Assets 4 Cash 5 Accounts receivable 6 inventories 7 Other current assets B Total current assets o 10 Property, plant and equipment, net 11 Goodwill 12 Other assets 13 Total non-current assets 14 15 TOTAL ASSETS 16 17 Liabilities & Equity 18 Financing gap/Revolver 19 Short term debt 20 Accounts payable 21 Other current abilities 22 Total current liabilities 23 24 Long-term Debt 25 Other Long-term Liabetes 26 Deferred charges 27 Total non-current liabilities 25 Total liabilities 29 30 Common stock and APIC 31 Treasury stock 32 Retained earnings 33 Other equity 34 Totat equity 35 TOTAL LIABILITIES & EQUITY 278.6 1,4759 1.090.5 2.846.0 836 1.9944 1,0848 3.162.8 7233 2.9792 3177 4,020.2 3.8926 1.7946 + 0.0 3.7026 1.425 4 00 5,128.0 8,290.8" 3,0630 9525 6193 4.624.B 8,645.0 5,687.2 8,633.2" 1038 (1080) 2.701.3 (4399) 2.2672 10.790.4 1046 (569.8) 3.2661 (5172) 2.283.7 10,574.5 1046 (9121) 3,830.4 (953.9) 2,0600 10.714.0 This modern cewed forcional poses only poranye pone Your assignment 1. Complete the balance sheet and income statement for 201A-2010. Find EBIT - core and recurring. (10 pts) 2. Project the financial statements (income statement & balance sheet) using the assumptions provided (40 pts). Be sure to set up an appropriate formula for the cash and Financing gap/Revolver accounts 3. Complete the forecasted cash flow statement (25 pts) 4. Which assumptions appear unrealistic? Explain why (10 pts) 5. Calculate the key measures and ratios on the summary sheet (15 pts). Use core, recurring EBIT if EBIT is required. Use year end values (not averages) for ratios 2 3 4 Forecast assumptions: Forecast based on the assumptions provided by management on the assumptions tab Assume no acquisitions Assume there will be no non-recurring items 27 28 29 30 31 Assumptions Incstat Balsheet Ratios 5 8 . Cover Calc Cashflow IT Hist. 201A D Hist. 2010 E Hist 2010 F Proj 2010 X G Proj 2015 H Proj 291F Proj 2016 Proj 2011 1.03 2015 1.09 520 1001 200 00 00 11,0 3074 210 3980 3980 150 100 62.05 10.02 2009 00 00 119 2074 2108 300 3900 1509 110 307 4 101 52.05. 110 20.0% DO 00 110 2074 21.04 3900 3000 TOS 5205 18.09 200% 90 00 180 20.0 00 00 110 3074 2105 3980 50 15.0% 9900 398 0 150 1 2 Assumptions 3 income statement 4 Sales growth 5 Cost of sales of sales 5 SMEA of Sales 7 Depreciation of beginning net PPSE 0 Pre-ta non recurring charges $ O Other income (expense) 5 amount 10 Interest income 11 Interest expenses 12 Electve tax rate 13 Basic WASO 14 Diluted WASO 15 Dividends - growth rate 16 Balance sheet: assets 12 Accounts receivable-sales 18 Inventory - % COGS 19 Other current sets of sales 20 Capital expenditures 211 Goodwill amount 22 Other assets of sales 23 Balance sheet: Nabilities & equity 24 Short term debt-5 balance 26 Accounts payable SCOGS 26 Other current liabilities of sales 27 Long term debt-repayment 20 Other long-term labities growth 29 Deferred charges 3 30 Common stock and APIC - 5 31 Treasury stock - 5 22 Other equity - 5 33 34 35 888 TON 2.5% 2400 00 25 13:04 2,546 00 00 ZONE 13.04 29 2500 0.0 75% 8.65 13 2513 28.00 13015 255 2500 75% 00 40.4% 00 DO 100 10 1046 1912-11 1953.00 00 40.453 20 00 100 6103 1046 191201 1963 91 00 00 4045 40.4 4045 30% 830 00 00 00 10.07 10.03 12.05 5103 56193 6193 1046 1045 1046 19131 (9120091211 19539639N 195199 6193 104.5 (9121 (9539) B K F Proj 2010 G Proj 2015 H Proj 2015 Proj 2016 Proj 2011 Hist. 201A 9.613.9 4,905.7 3470 4,361.2 2,5512 D Hist. 2013 10,1772 5,1753 346.3 4,655.6 2,815,3 97.0 9.0 3003 (269) 3,194.7" 444.7 2.750.0 E Hist. 2010 10.906.7 5,6763 3312 4,899.2 3,0514 820 11.0 307.4 22 3,454.0 467.5 2.986.5 F 1289 70 308.6 (13.6) 2,982.1 4753 2,506.8 (4176) (4352) (4398) 2 Income Statement thousands 3 Net sales 4 Cast of sales - excl depreciation 5 Depreciation 6 Gross profit 7 Selling, marketing and administrative 8 Non-recurring charges (income) 9 Interest income 10 Interest expense 11 Other income (expense) 12 Prolit before tax 13 Tax 14 Profit after tax 15 16 Dividends 17 18 Shareholder information 19 Basic WASO 20 Diluted WASO 21 Basic recurring EPS 72 Diluted recurring EPS 23 Dividend per share 24 25 Complete the income statement 26 Find core recurring EINT 27 20 Core, recurring EBIT 29 30 31 Net Income as reported 32 33 34 35 36 37 38 4120 416.4 5.08 4120 415.6 6.67 F 3970 400.4 752 1.01 1.06 1.11 1,810.0 1.840 3 1,8478 890.6 9804 1,004,1 Cover Assumptions Calcs IncStat BalSheet Cashflow Ratios 201A 2013 Hist. 2010 Proj 2010 Proj Proj 2015 Proj 2010 Proj 2017 2011 417 4 776.4 6810 2470 219.1 879 1 7170 381.3 2,195.5 4106 10507 8239 131.8 2,427.0 2,121.8" 2,7151 5.1162 837.3 8,668.6' 2.6484 4,893,5 8361 2,815,6 4,868.0 603 4 8.287.0 8,378.0" 10,790.4 10,574.5 10.714.0 lance Sheets thousands 3 Assets 4 Cash 5 Accounts receivable 6 inventories 7 Other current assets B Total current assets o 10 Property, plant and equipment, net 11 Goodwill 12 Other assets 13 Total non-current assets 14 15 TOTAL ASSETS 16 17 Liabilities & Equity 18 Financing gap/Revolver 19 Short term debt 20 Accounts payable 21 Other current abilities 22 Total current liabilities 23 24 Long-term Debt 25 Other Long-term Liabetes 26 Deferred charges 27 Total non-current liabilities 25 Total liabilities 29 30 Common stock and APIC 31 Treasury stock 32 Retained earnings 33 Other equity 34 Totat equity 35 TOTAL LIABILITIES & EQUITY 278.6 1,4759 1.090.5 2.846.0 836 1.9944 1,0848 3.162.8 7233 2.9792 3177 4,020.2 3.8926 1.7946 + 0.0 3.7026 1.425 4 00 5,128.0 8,290.8" 3,0630 9525 6193 4.624.B 8,645.0 5,687.2 8,633.2" 1038 (1080) 2.701.3 (4399) 2.2672 10.790.4 1046 (569.8) 3.2661 (5172) 2.283.7 10,574.5 1046 (9121) 3,830.4 (953.9) 2,0600 10.714.0


