Question
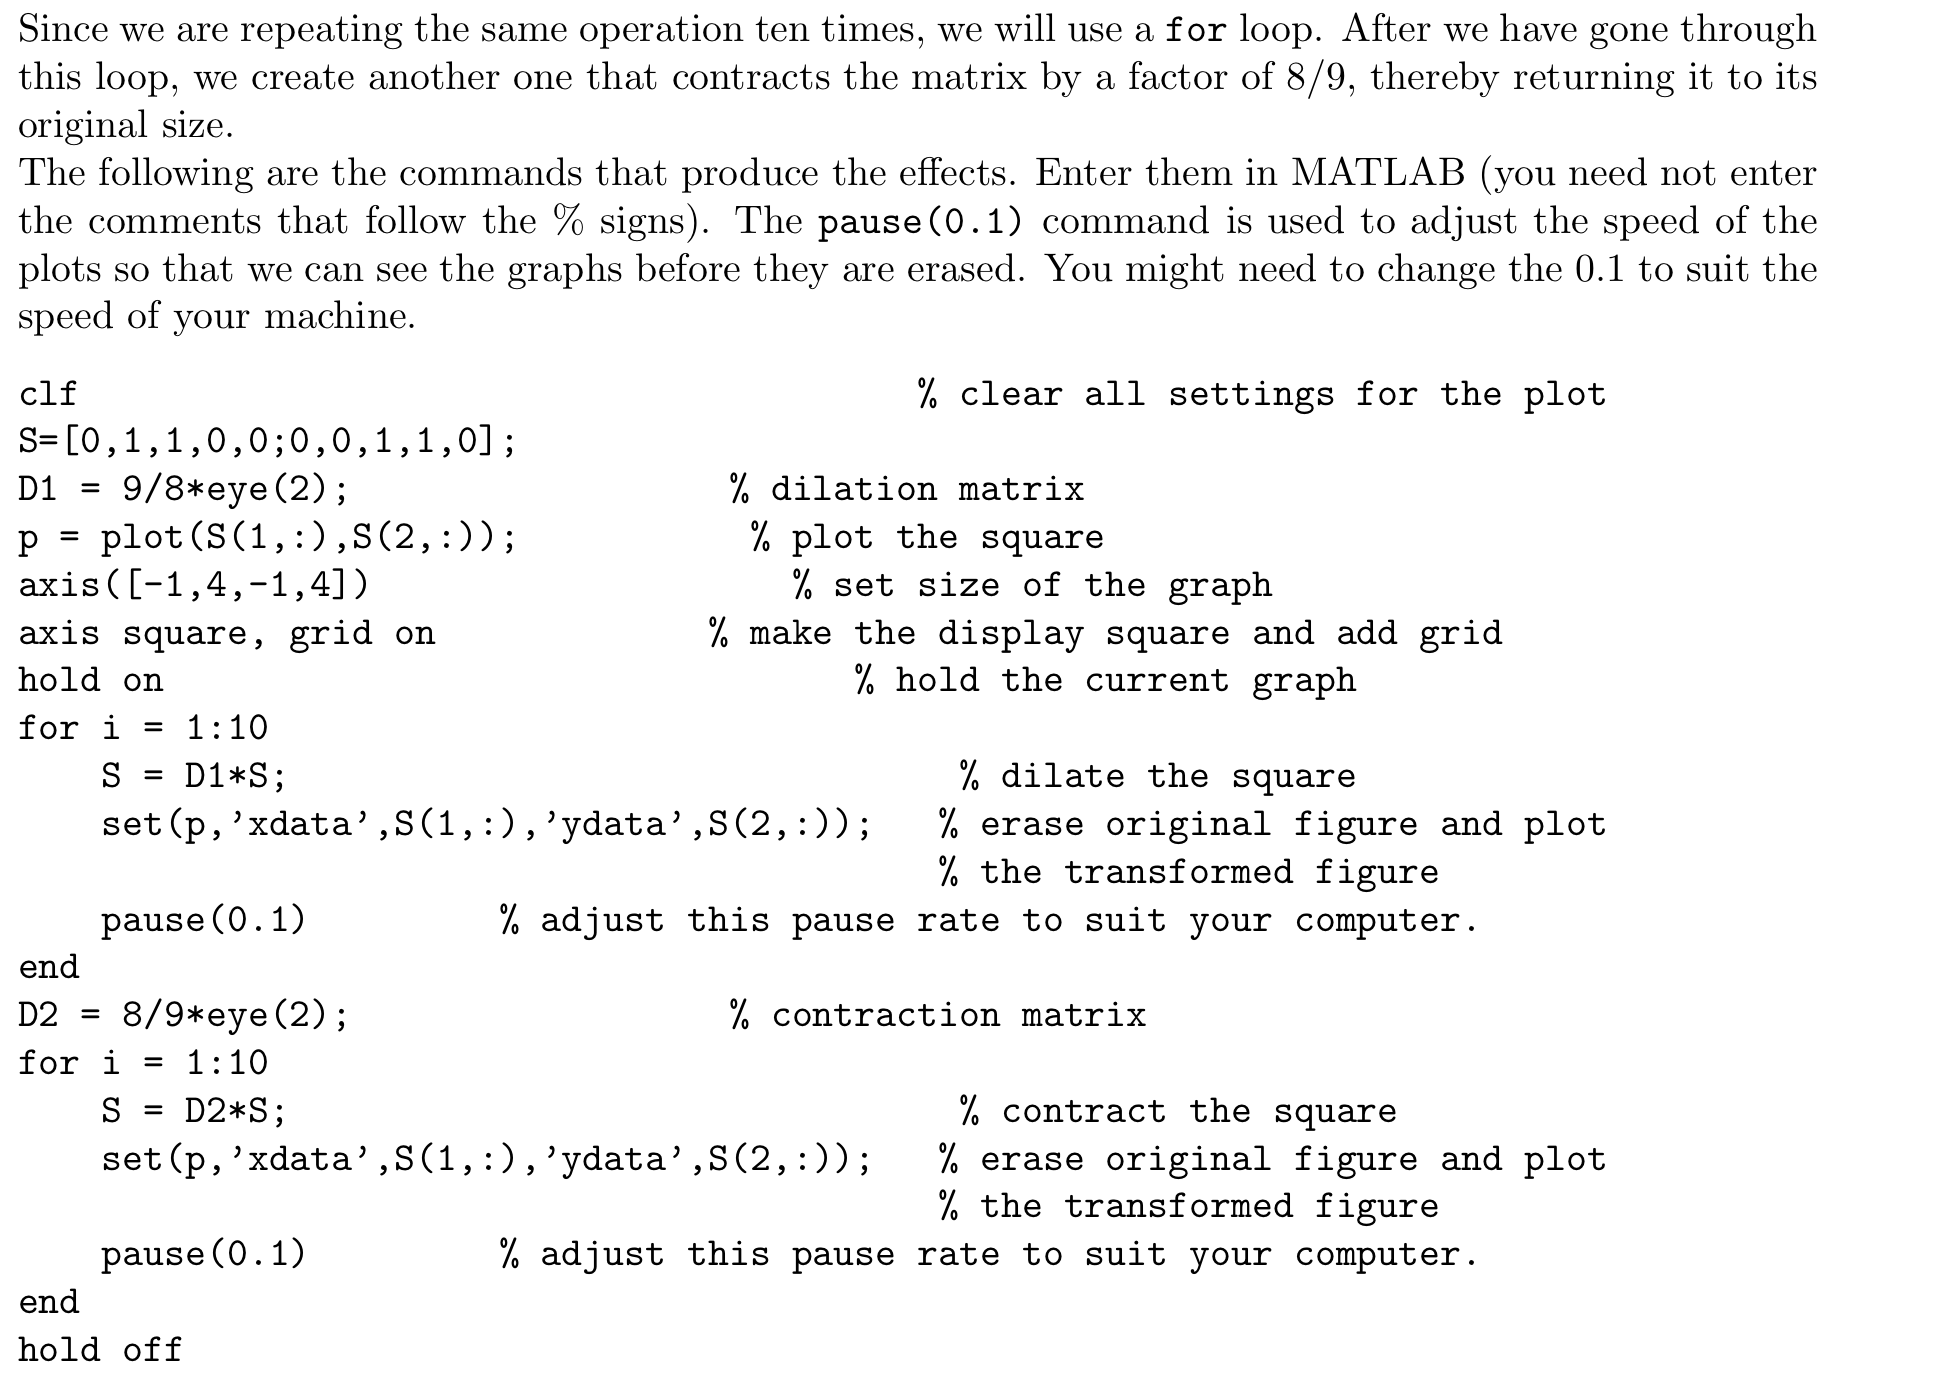
***THIS MUST BE DONE IN MATLAB*** 3) Adapt the procedure developed in Example 6 to rotate the square counterclockwise by increments of /10 about the
***THIS MUST BE DONE IN MATLAB***
3) Adapt the procedure developed in Example 6 to rotate the square counterclockwise by increments of /10 about the origin. Stop when the square is in its original location and then rotate it in the clockwise direction until the square is in its original location again. You may want to rescale the axis to axis([-2,2,-2,2])
Include the M-file. Do not include the figure. Hint: Since you are performing a computation several times, you will want to use two for loops: one loop for the counterclockwise rotation and another one for the clockwise rotation. Think about how many times you will need to go through the loops, keeping in mind that you are rotating the square counterclockwise for a full circle by increments of /10 and then rotating the square clockwise back again.
4. Adapt the procedure developed in Example 6 to show the square rotating in a counterclockwise direction about the origin by increments of /10 for a total angle of 2 and expanding at the same time by a factor of 11/10, then stopping and rotating in the clockwise direction as it shrinks to its original size (with a contraction factor of 10/11). At the end of the program, the figure should have returned to its original size and original location.
You may want to rescale the axis to axis([-8,8,-8,8]) Include the M-file. Do not include the figure. Hint: Similarly to Exercise 3, you might want to use two for loops: one loop for the counterclock- wise rotation + dilation, and another one for the clockwise rotation + contraction. Think about how many times you will need to go through the loops.


Step by Step Solution
There are 3 Steps involved in it
Step: 1

Get Instant Access to Expert-Tailored Solutions
See step-by-step solutions with expert insights and AI powered tools for academic success
Step: 2

Step: 3

Ace Your Homework with AI
Get the answers you need in no time with our AI-driven, step-by-step assistance
Get Started


