

Question
This part of the case is a continuation of the analytical procedures portion of the audit. You must refer to Part 1 (pictured above) where
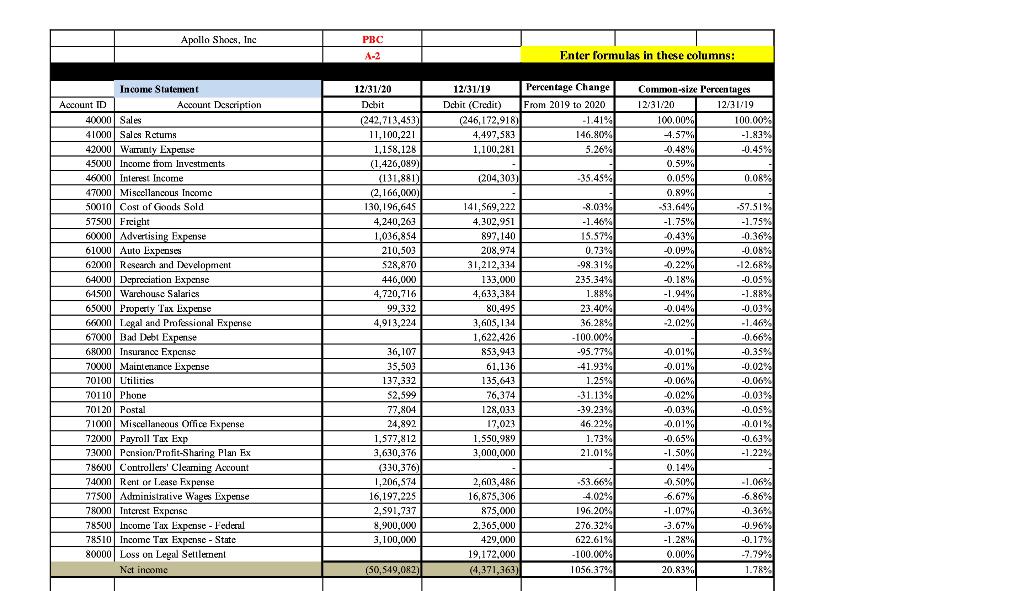
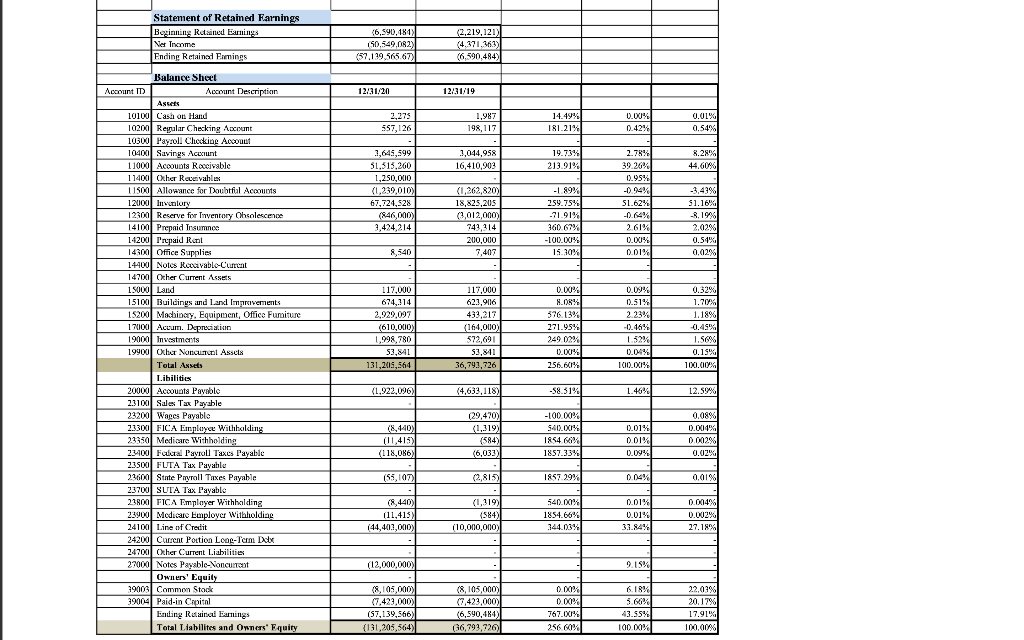
This part of the case is a continuation of the analytical procedures portion of the audit. You must refer to Part 1 (pictured above) where you prepared common-size income statements and balance sheets.
In this assignment, you will be focusing on the audit of sales and cost of goods sold on the income statement and the related balance sheet accounts (accounts receivable and inventory). Consider the net income as well.
For each account (sales-net, cost of goods sold, accounts receivable, and inventory) on the attached workpaper you are to:
- Identify warning signs (unexpected or unusual relationships or trends).
- What could be a potential problem? You obviously do not have access to all relevant information but you can identify potential concerns or areas of strength. Brainstorm. Try to consider what could have occurred. Consider possible errors and irregularities.
For example, do not just state that a percentage increased. Try to identify the possible causes of the change. Attempt to relate the different types of financial data. Remember that in accrual basis accounting the income statement and balance sheet are closely related.
*Organize your findings in such a way that someone else can pick up your work and understand it, especially when identifying concerns or weaknesses. Always support your conclusions with the appropriate evidence, and remember that narrative descriptions will be best understood when written concisely.
| Potential Problem Areas Identify warning signs from the common-size income statements and common-size balance sheets. | ||
| Account: | Warning signs (unexpected or unusual relationships or trends): | Identify and explain potential problems or concerns. What are possible causes? |
| Sales- Net | ||
| Cost of Goods Sold | ||
| Accounts Receivable | ||
| Inventory | ||
Apollo Shoes, Inc PBC A-2 Enter formulas in these columns: 12/31/19 Percentage Change Dchit (Credit) From 2019 to 2020 (246,172,918) -1.41% 4.497,583 146.80% 1,100,281 5.26% (204,303 -35.45% 12/31/20 Dchit (242,713,453) 11,100,221 1,158,128 (1,426,089) (131.881) (2,166,000) 130,196,645 4,240,263 1,036,854 210,503 528,870 446,000 4,720,716 99,332 4,913,224 Income Statement Account ID Account Description 40000 Sales 41000 | Sales Rctums 42000 | Warunty Experise 45000 Income from Investments 46000 Interest Income 47000 Miscellancous Income 50010 Cost of Goods Sold 57500 Freight 60000 Advertising Expense 61000 Auto Expenses 62000 Research and Development 64000 Depreciation Expense 641500 | Warchouse Salaries 65000 Property Tax Expense 66000 Legal and Professional Expense 67000 Bad Debt Expense 68000 Insurance Expense 70000 Maintenance Expense 70100 Utilities 70110 Phone 70120 | Portal 71000 Miscellaneous Office Expense 72000 Payroll Tax Exp 73000 Pension:Profit Sharing Plan Ex 78600 Controllers Clearning Account 74000 Rent or Lease Expense 77500 Administrative Wages Expense 78000 Interest Expense 78500 Income Tax Expense - Federal 78510 Income Tax Expense - State 80000 Loss on Legal Settlernen Net income 141,569,222 4.302,951 897,140 208,974 31,212,334 133,000 4.633,384 80,495 3,605,134 1,622,426 853,943 61,136 135,643 76,374 128,033 17,023 1.550,989 3,000,000 -8.03% -1.46% 15.57% 0.73% -98.31% 235.34% 1.88% 23.40% 36.28% -100.00% -95.77% -41.93% 1.25% -31.13% -39.23% 46.22% 1.73% 21.01% Common-size Percentages 12/31/20 12/31/19 100.00% 100.00% -4.57% -1.83 -0.48% -0.45% 0.59% 0.05% 0.08% 0.89% -53.64% 57-51% -1.75% -1.75% -0,43% -0.36% -0.09% -0.08% -0.22% -12.68% -0.18% -0.05% -1.94% -1.88% -0.04% -0.03% -2.02% -1.46% -0.66% -0.01% -0.35% -0.01% -0.02% -0.06% -0.06% -0.02% -0.03% -0,03% -0.05% -0.01% -0.01% % -0.65% -0.63% -1.50% -1.22% 0.14% -0.50% -1.06% 6.67% -6.86% -1.07% -0.36% -3.67% -0.96% % -1.28% -0.17% 0.00% -7.79% 20.8394 1.78% 36,107 35,503 137,332 52,599 77,804 24,892 1,577,812 3,630,376 (330.376) 1,206,574 16.197.225 2,591,737 8,900,000 3,100,0XXO 2,603,486 16,875,306 875,000 2,365,000 429,000 19,172,000 (4,371,363) -53.66% 4.02% 196.20% 276.32% 622.61% -100.00% 1056.37% (50,549,082) Statement of Retainer Farnings Beginning Retained Earnings Net Income Ending Retaino Ermings (2.219,121) (6,590,484) (50,549,082 (57.199.565.67) (6,590,484) 12/31/20 12/31/19 2,275 557,126 1,987 198,117 14.49% 181.21% 0.00% 0.42% 0.01% 0.54% 8.28% 3,044,958 16,410,903 19.73% 213.91% 2.78% 39.26% 0.95% 44.60% 1,645,599 51,513,260 1,250,000 (1,239,010) 67,724,528 (846,000) 3,424,214 (1,262,820) 18,825,205 (3,012,000) 743,314 200,000 7,407 259.75% -71.91% 360 67% -100.00% 150W 51.62% -0.64% 2.61% 0.00% 0.01% -3.43% $1.16% -8.1996 2.02% 0.54% 0.02% & 540 0.00% Balance Sheet Account ID Account Description Assets 10100 Cash on Hand 10200 Regular Checking Account 10500 Payroll Checking Account 10400 Savings Account 11000 Accounts Recivable 11400 Other Receivables 11500 Allowance for Doubtful Accounts 12000 Invlor 12300 Reserve for Inventory Obsolescence 14100 Prepaid Treumno 14200 Prepaid Ron 143001 Office Supplies 14400 Notes Rocavablo-Current 147001 Other Current Assets 15000 Land 15100 Buildings and Land (marcivements 15200 Machiocy. Equipment, Office Furniture 174100 Accum. Depreciation 19000l Investments 19900 Other Non Assets Total Assets Libilities 20000 Accounts Payable 73100 Sales Tax Payable 232001 Wages Payable 23300 FICA Employee Withhuilding 23350 Medicare Withholding 24400 Fokal Payroll Taxes Payable 23500 FUTA Tax Payable 23600 State Payroll Taxes Payable 23700 SUTA Tax Payable 23800 FICA Employer Withholding 23900 Medical Employer Withholding 24100 Line of Credit 24200 Current Portion Loog-Term Dickx 24700 Other Current Liabilities 27000 Notes Payable-Noncurrut Owners' Equity 19003 Common Stock 39004 Paid-in Capital Ending Rain Earnings Total Liabilites and Onners' Equity 117,000 674,114 2,929,097 (610,000) 1,998,780 53,841 131,205,564 117,000 62.1,9116 433,217 (164,000) 572,691 576.13% 271.95% 249 02% 0.00% 256.6014 0.09% 0.51% 2.23% -0.46% 1.52% 0.04% 100.0% 0.329 1.70% 1.18% -0.45 1.50% 0.15% 100.00% 52,841 36,743,726 (1.922,096) (4,633,118) -58.31% 1.46% 12.59% (8,140) (11,415 (118,086) (29,470) (1.319) (584) (6,033) -100.00% 540.00% 1884 66% 1857.334: 0.01% 0.01% 0.09% 0.08% 0.0.14% 0.002% 0.02% (55,107) (2,815) 1857.29% 0.04% 0.01% (8,440 (11,415) (44,400,000) (1,319) (584 (10,000,000) 540.005 1854.66% 144.03% 0.01% 0.01% 3.3.84% 0.004% 0.002% 27.18% (12,000,000) 9.15% 0.001% (8,105,000) (7.423,000) (S7,139,566) (131,205,564) (8,105,000) (7,423,000) (6,590,14) 66,793,726 6.18% 5.66% 43.55% 100.00% 22,01% 20.17% 17.91% 100.00% 767.0X1% 256 60% Apollo Shoes, Inc PBC A-2 Enter formulas in these columns: 12/31/19 Percentage Change Dchit (Credit) From 2019 to 2020 (246,172,918) -1.41% 4.497,583 146.80% 1,100,281 5.26% (204,303 -35.45% 12/31/20 Dchit (242,713,453) 11,100,221 1,158,128 (1,426,089) (131.881) (2,166,000) 130,196,645 4,240,263 1,036,854 210,503 528,870 446,000 4,720,716 99,332 4,913,224 Income Statement Account ID Account Description 40000 Sales 41000 | Sales Rctums 42000 | Warunty Experise 45000 Income from Investments 46000 Interest Income 47000 Miscellancous Income 50010 Cost of Goods Sold 57500 Freight 60000 Advertising Expense 61000 Auto Expenses 62000 Research and Development 64000 Depreciation Expense 641500 | Warchouse Salaries 65000 Property Tax Expense 66000 Legal and Professional Expense 67000 Bad Debt Expense 68000 Insurance Expense 70000 Maintenance Expense 70100 Utilities 70110 Phone 70120 | Portal 71000 Miscellaneous Office Expense 72000 Payroll Tax Exp 73000 Pension:Profit Sharing Plan Ex 78600 Controllers Clearning Account 74000 Rent or Lease Expense 77500 Administrative Wages Expense 78000 Interest Expense 78500 Income Tax Expense - Federal 78510 Income Tax Expense - State 80000 Loss on Legal Settlernen Net income 141,569,222 4.302,951 897,140 208,974 31,212,334 133,000 4.633,384 80,495 3,605,134 1,622,426 853,943 61,136 135,643 76,374 128,033 17,023 1.550,989 3,000,000 -8.03% -1.46% 15.57% 0.73% -98.31% 235.34% 1.88% 23.40% 36.28% -100.00% -95.77% -41.93% 1.25% -31.13% -39.23% 46.22% 1.73% 21.01% Common-size Percentages 12/31/20 12/31/19 100.00% 100.00% -4.57% -1.83 -0.48% -0.45% 0.59% 0.05% 0.08% 0.89% -53.64% 57-51% -1.75% -1.75% -0,43% -0.36% -0.09% -0.08% -0.22% -12.68% -0.18% -0.05% -1.94% -1.88% -0.04% -0.03% -2.02% -1.46% -0.66% -0.01% -0.35% -0.01% -0.02% -0.06% -0.06% -0.02% -0.03% -0,03% -0.05% -0.01% -0.01% % -0.65% -0.63% -1.50% -1.22% 0.14% -0.50% -1.06% 6.67% -6.86% -1.07% -0.36% -3.67% -0.96% % -1.28% -0.17% 0.00% -7.79% 20.8394 1.78% 36,107 35,503 137,332 52,599 77,804 24,892 1,577,812 3,630,376 (330.376) 1,206,574 16.197.225 2,591,737 8,900,000 3,100,0XXO 2,603,486 16,875,306 875,000 2,365,000 429,000 19,172,000 (4,371,363) -53.66% 4.02% 196.20% 276.32% 622.61% -100.00% 1056.37% (50,549,082) Statement of Retainer Farnings Beginning Retained Earnings Net Income Ending Retaino Ermings (2.219,121) (6,590,484) (50,549,082 (57.199.565.67) (6,590,484) 12/31/20 12/31/19 2,275 557,126 1,987 198,117 14.49% 181.21% 0.00% 0.42% 0.01% 0.54% 8.28% 3,044,958 16,410,903 19.73% 213.91% 2.78% 39.26% 0.95% 44.60% 1,645,599 51,513,260 1,250,000 (1,239,010) 67,724,528 (846,000) 3,424,214 (1,262,820) 18,825,205 (3,012,000) 743,314 200,000 7,407 259.75% -71.91% 360 67% -100.00% 150W 51.62% -0.64% 2.61% 0.00% 0.01% -3.43% $1.16% -8.1996 2.02% 0.54% 0.02% & 540 0.00% Balance Sheet Account ID Account Description Assets 10100 Cash on Hand 10200 Regular Checking Account 10500 Payroll Checking Account 10400 Savings Account 11000 Accounts Recivable 11400 Other Receivables 11500 Allowance for Doubtful Accounts 12000 Invlor 12300 Reserve for Inventory Obsolescence 14100 Prepaid Treumno 14200 Prepaid Ron 143001 Office Supplies 14400 Notes Rocavablo-Current 147001 Other Current Assets 15000 Land 15100 Buildings and Land (marcivements 15200 Machiocy. Equipment, Office Furniture 174100 Accum. Depreciation 19000l Investments 19900 Other Non Assets Total Assets Libilities 20000 Accounts Payable 73100 Sales Tax Payable 232001 Wages Payable 23300 FICA Employee Withhuilding 23350 Medicare Withholding 24400 Fokal Payroll Taxes Payable 23500 FUTA Tax Payable 23600 State Payroll Taxes Payable 23700 SUTA Tax Payable 23800 FICA Employer Withholding 23900 Medical Employer Withholding 24100 Line of Credit 24200 Current Portion Loog-Term Dickx 24700 Other Current Liabilities 27000 Notes Payable-Noncurrut Owners' Equity 19003 Common Stock 39004 Paid-in Capital Ending Rain Earnings Total Liabilites and Onners' Equity 117,000 674,114 2,929,097 (610,000) 1,998,780 53,841 131,205,564 117,000 62.1,9116 433,217 (164,000) 572,691 576.13% 271.95% 249 02% 0.00% 256.6014 0.09% 0.51% 2.23% -0.46% 1.52% 0.04% 100.0% 0.329 1.70% 1.18% -0.45 1.50% 0.15% 100.00% 52,841 36,743,726 (1.922,096) (4,633,118) -58.31% 1.46% 12.59% (8,140) (11,415 (118,086) (29,470) (1.319) (584) (6,033) -100.00% 540.00% 1884 66% 1857.334: 0.01% 0.01% 0.09% 0.08% 0.0.14% 0.002% 0.02% (55,107) (2,815) 1857.29% 0.04% 0.01% (8,440 (11,415) (44,400,000) (1,319) (584 (10,000,000) 540.005 1854.66% 144.03% 0.01% 0.01% 3.3.84% 0.004% 0.002% 27.18% (12,000,000) 9.15% 0.001% (8,105,000) (7.423,000) (S7,139,566) (131,205,564) (8,105,000) (7,423,000) (6,590,14) 66,793,726 6.18% 5.66% 43.55% 100.00% 22,01% 20.17% 17.91% 100.00% 767.0X1% 256 60%
Step by Step Solution
There are 3 Steps involved in it
Step: 1

Get Instant Access to Expert-Tailored Solutions
See step-by-step solutions with expert insights and AI powered tools for academic success
Step: 2

Step: 3
Ace Your Homework with AI
Get the answers you need in no time with our AI-driven, step-by-step assistance
Get Started
Ouch What You Dont Know About Money And Why It Matters More Than You Think
Authors: Paul Knott
1st Edition
0133527077,0273788752