Answered step by step
Verified Expert Solution
Question
1 Approved Answer
This part of the project includes an analysis of the correlations (if any) between options trading and the historical prices of individual stocks and


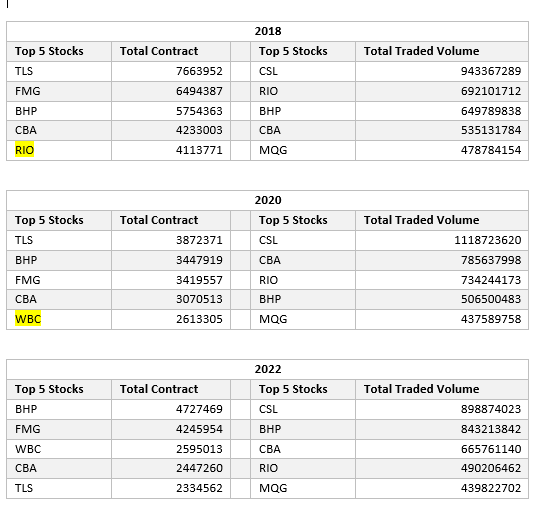
This part of the project includes an analysis of the correlations (if any) between options trading and the historical prices of individual stocks and suggests hedging trading strategies using options under different scenarios. Question 1: Based on the provided data, identify the top 5 most traded stocks in the Australian equity-link options market in 2018, 2020, and 2022, in terms of the number of contracts and volume. Comment on the change(s) if any. 2018 Top 5 Stocks Total Contract Top 5 Stocks Total Traded Volume TLS 7663952 CSL 943367289 FMG 6494387 RIO 692101712 BHP 5754363 BHP 649789838 CBA RIO 4233003 CBA 535131784 4113771 MQG 478784154 2020 Top 5 Stocks Total Contract Top 5 Stocks Total Traded Volume TLS 3872371 CSL 1118723620 BHP 3447919 CBA 785637998 FMG 3419557 RIO 734244173 CBA 3070513 BHP 506500483 WBC 2613305 MQG 437589758 2022 Top 5 Stocks Total Contract Top 5 Stocks Total Traded Volume BHP 4727469 CSL 898874023 FMG 4245954 BHP 843213842 WBC 2595013 CBA 665761140 CBA 2447260 RIO 490206462 TLS 2334562 MQG 439822702
Step by Step Solution
There are 3 Steps involved in it
Step: 1

Get Instant Access to Expert-Tailored Solutions
See step-by-step solutions with expert insights and AI powered tools for academic success
Step: 2

Step: 3

Ace Your Homework with AI
Get the answers you need in no time with our AI-driven, step-by-step assistance
Get Started


