Question
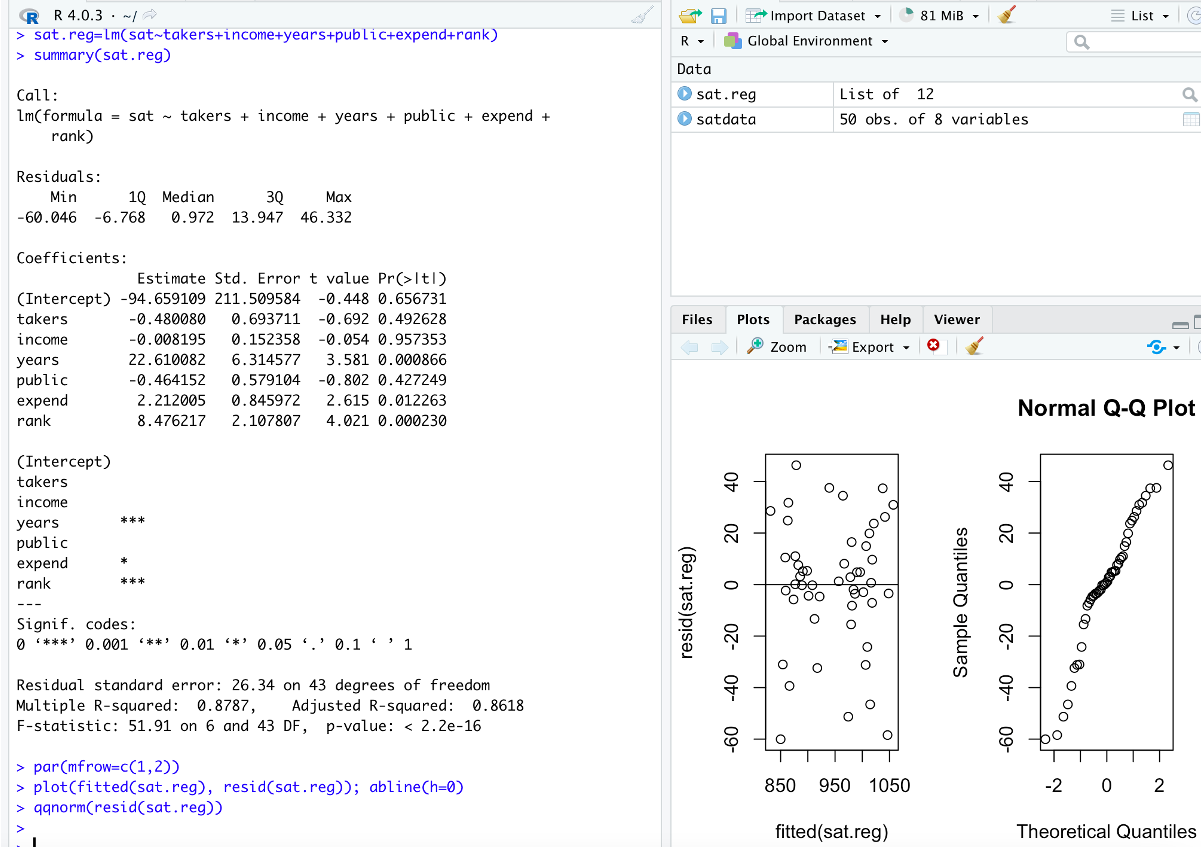
This problem is answered using the R code provided. The data set is from the first year that SAT scores were published on a state-by-state
This problem is answered using the R code provided.
The data set is from the first year that SAT scores were published on a state-by-state basis in the U.S. It was originally published in the Harvard Educational Review in 1984, and is also reported in Ramsey and Schafer, 1997.
The variables included are:
sat = average total SAT score for the state
takers = percent of eligible students in the state who took the exam
income = the median family income of students in the state who took the exam
years = the average number of years that the test-takers had for studies in the core subjects
public = percentage of test takers attending public secondary schools
expend = the states expenditures on education in hundreds of dollars per student
rank = the median percentile ranking of the test-takers in their high-school class
a)Test whether the other six variables as a group are statistically significant predictors of the states average SAT scores. (Report the p-value and your conclusion)
b)Check the assumptions, and state whether you feel comfortable trusting the results of the regression.
c)Report the p-value for the t test for takers and interpret the results at an ?=0.05 level.
d)What percentage of the variation in state average SAT score do the six variables explain?
R code output in png

Step by Step Solution
There are 3 Steps involved in it
Step: 1

Get Instant Access to Expert-Tailored Solutions
See step-by-step solutions with expert insights and AI powered tools for academic success
Step: 2

Step: 3

Ace Your Homework with AI
Get the answers you need in no time with our AI-driven, step-by-step assistance
Get Started


