This problem is based on weather data collected at the local Halifax Airport (YHZ) in 2020 (source: Canadian Government). One of the variables measured is
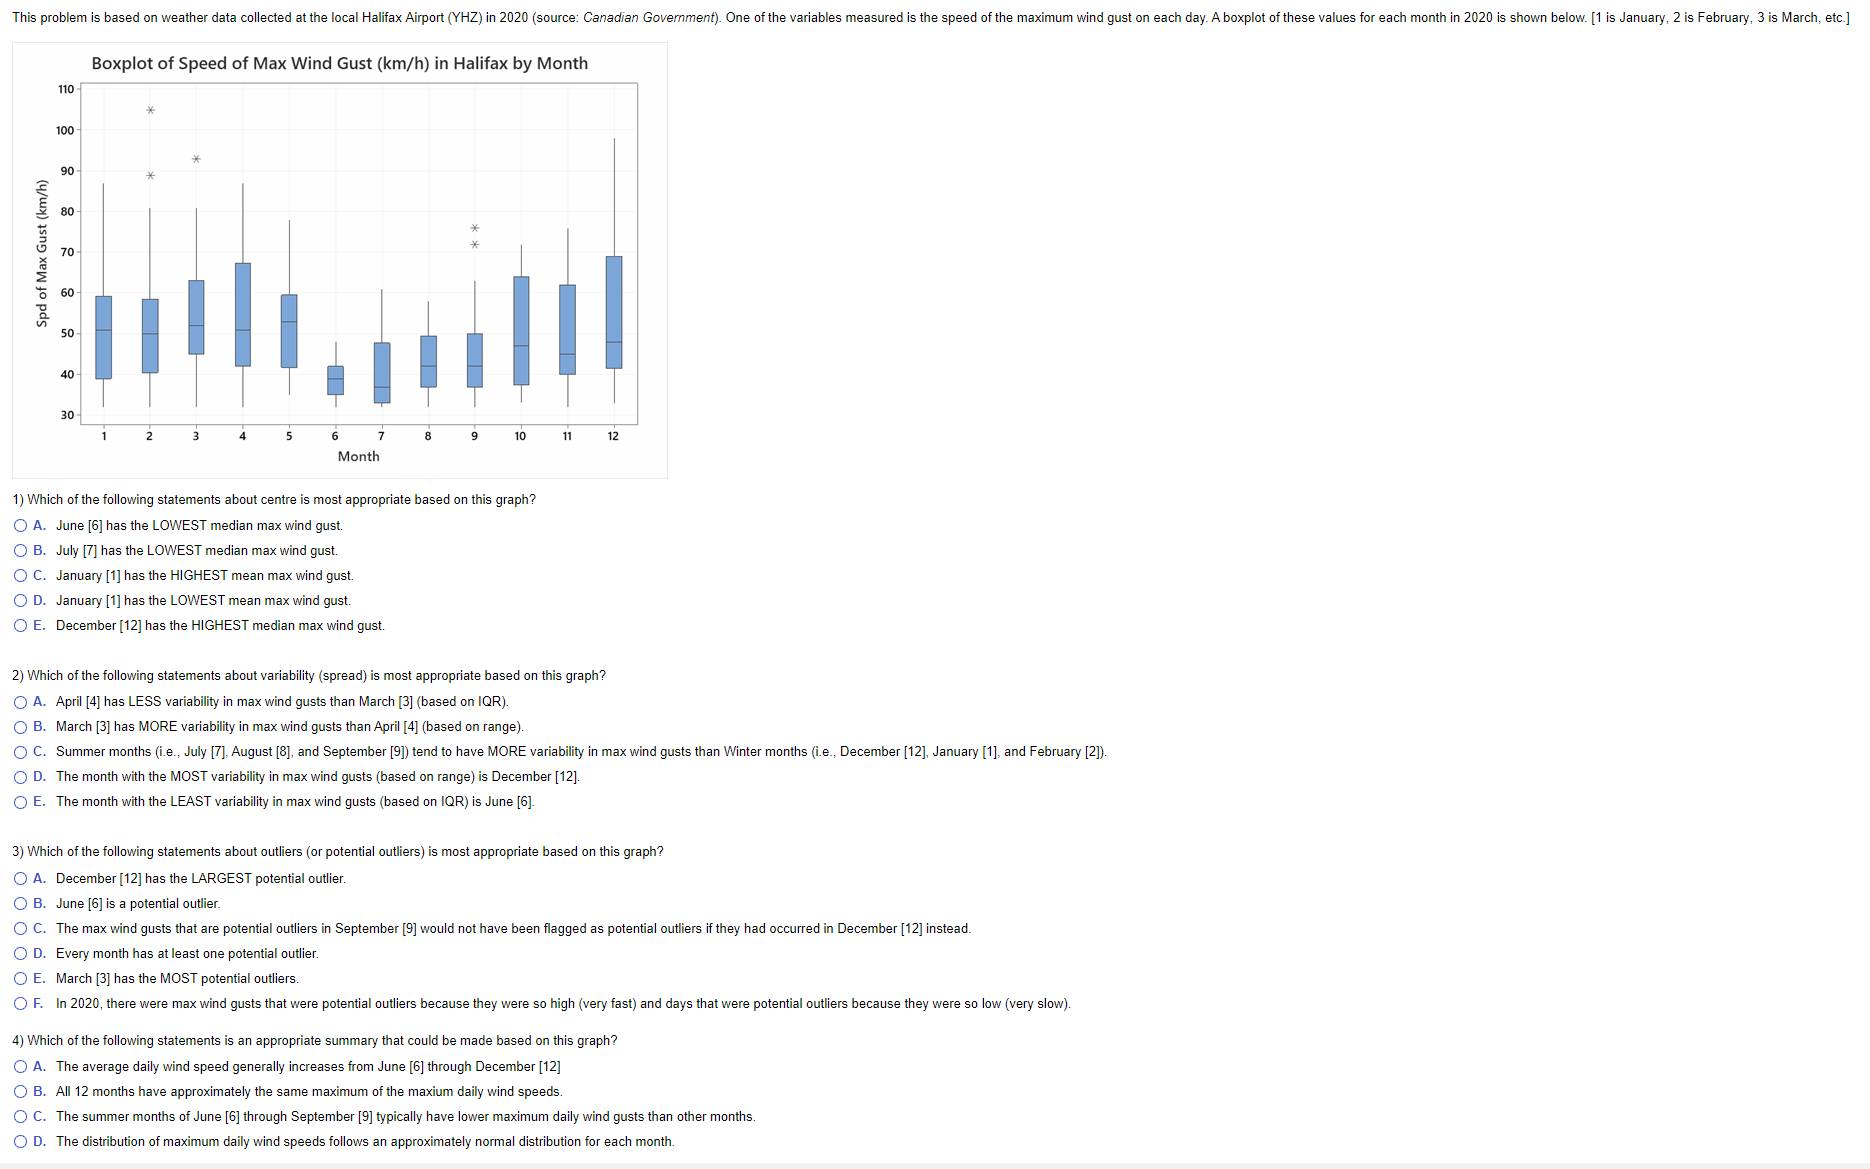
This problem is based on weather data collected at the local Halifax Airport (YHZ) in 2020 (source: Canadian Government). One of the variables measured is the speed of the maximum wind gust on each day. A boxplot of these values for each month in 2020 is shown below. [1 is January, 2 is February, 3 is March, etc.] Boxplot of Speed of Max Wind Gust (km/h) in Halifax by Month 110 100 90 80 Spd of Max Gust (km/h) 70 60 40 30 6 9 10 11 12 Month 1) Which of the following statements about centre is most appropriate based on this graph? O A. June [6] has the LOWEST median max wind gust. O B. July [7] has the LOWEST median max wind gust. O C. January [1] has the HIGHEST mean max wind gust. O D. January [1] has the LOWEST mean max wind gust. O E. December [12] has the HIGHEST median max wind gust. 2) Which of the following statements about variability (spread) is most appropriate based on this graph? O A. April [4] has LESS variability in max wind gusts than March [3] (based on IQR). O B. March [3] has MORE variability in max wind gusts than April [4] (based on range). O C. Summer months (i.e., July [7], August [8], and September [9]) tend to have MORE variability in max wind gusts than Winter months (i.e., December [12], January [1], and February [2]). O D. The month with the MOST variability in max wind gusts (based on range) is December [12]. O E. The month with the LEAST variability in max wind gusts (based on IQR) is June [6]. 3) Which of the following statements about outliers (or potential outliers) is most appropriate based on this graph? O A. December [12] has the LARGEST potential outlier. O B. June [6] is a potential outlier. O C. The max wind gusts that are potential outliers in September [9] would not have been flagged as potential outliers if they had occurred in December [12] instead. O D. Every month has at least one potential outlier. O E. March [3] has the MOST potential outliers. O F. In 2020, there were max wind gusts that were potential outliers because they were so high (very fast) and days that were potential outliers because they were so low (very slow). 4) Which of the following statements is an appropriate summary that could be made based on this graph? O A. The average daily wind speed generally increases from June [6] through December [12] O B. All 12 months have approximately the same maximum of the maxium daily wind speeds. O C. The summer months of June [6] through September [9] typically have lower maximum daily wind gusts than other months. O D. The distribution of maximum daily wind speeds follows an approximately normal distribution for each month
Step by Step Solution
There are 3 Steps involved in it
Step: 1
Get Instant Access to Expert-Tailored Solutions
See step-by-step solutions with expert insights and AI powered tools for academic success
Step: 2
Step: 3
Ace Your Homework with AI
Get the answers you need in no time with our AI-driven, step-by-step assistance