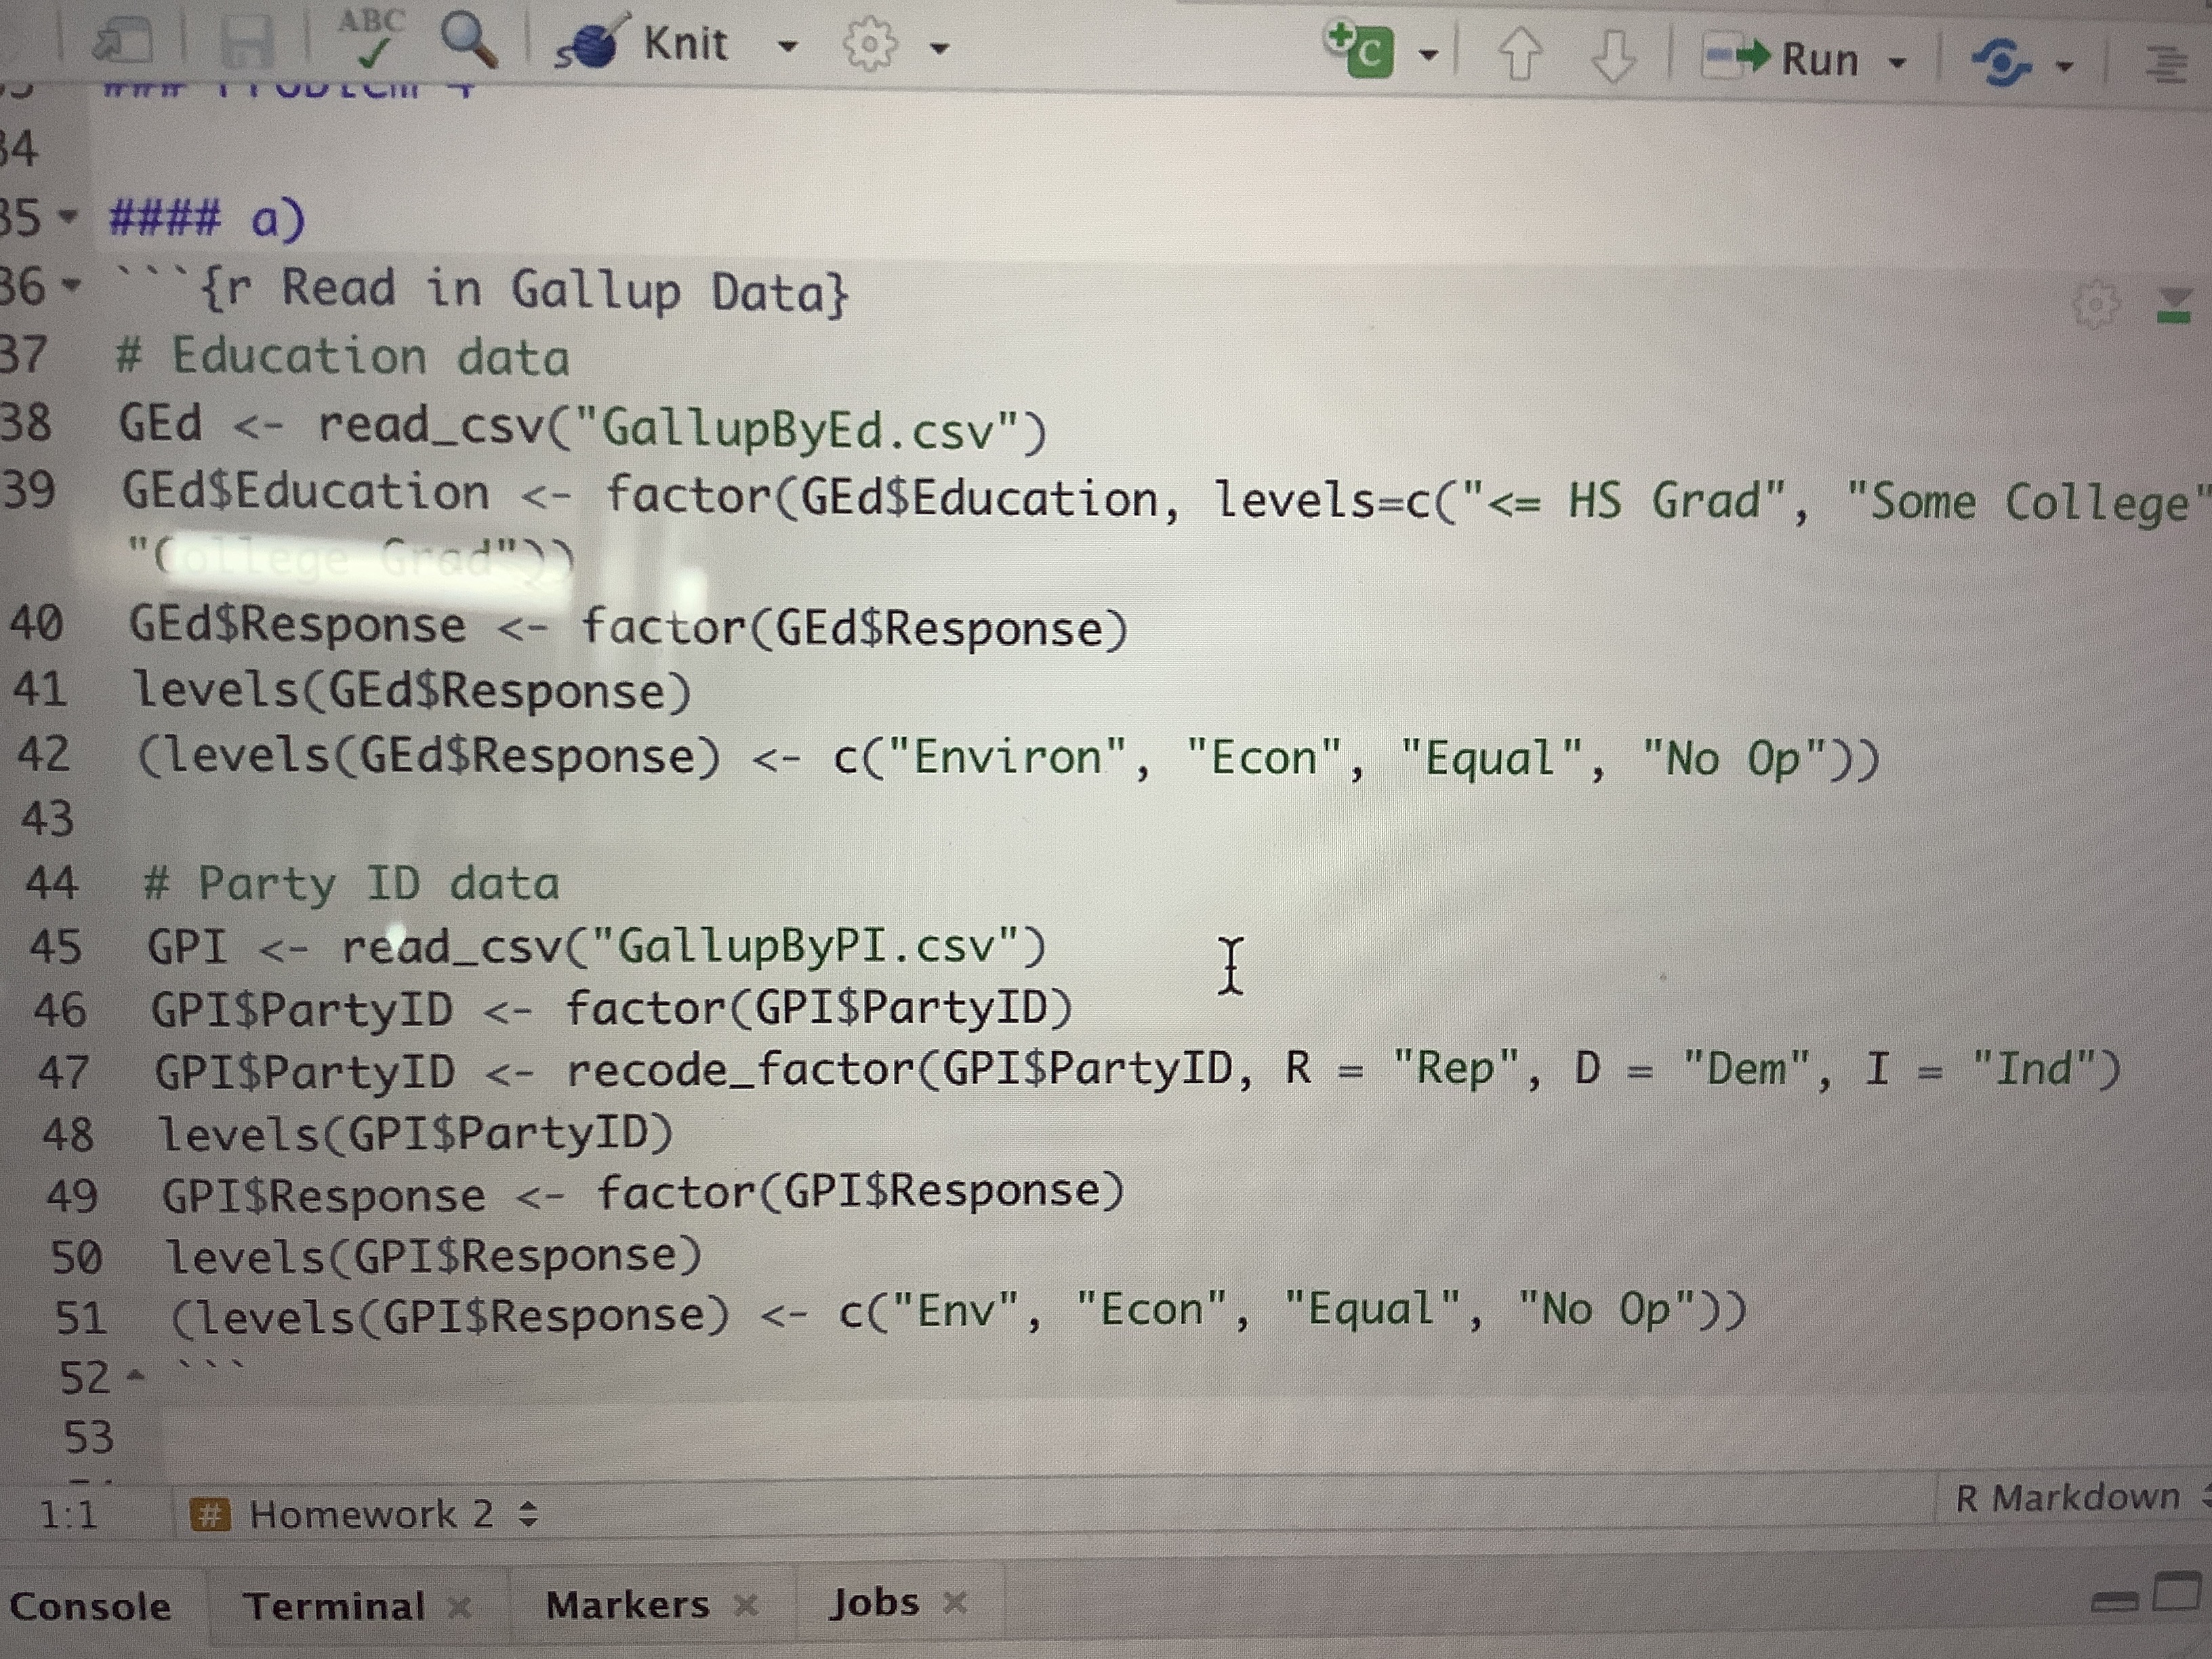
This problem uses the same data regarding environmental policy versus economic policy that were presented in Lesson 2, Lecture 1, except the data are categorized
This problem uses the same data regarding environmental policy versus economic policy that were presented in Lesson 2, Lecture 1, except the data are categorized by education level or party identity. a) Read in GallupByEd.csv and GallupByPI.csv, creating two separate objects that store the data. Convert variables in each object to factors as needed. Think about the order in which the factors will appear on output and adjust if you think reordering will make things clearer. How many observations are there in each data set? b) Produce two two-way contingency tables, one for each data set, with education or party ID in rows and the response in the columns. c) What is the joint percentage of people who favor environmental policy and who identify as independents? d) What is the marginal distribution (as percentages) for education? [Hint: you will be reporting three percentages] e) Produce two more tables that show row conditional percentages instead of counts. What is the conditional distribution for Response for those participants who identify as republican? f) Pick one of the two data sets and create two bar graphs (your choice of versions) to explore the association between either education or party ID and Response. Make sure the axes are appropriately labeled. Summarize the information you glean from the bar graphs. g) For the data set you picked, does the row variable (either education or party ID) appear to be associated with the response. Explain. [Note: this is a qualitative answer based on data visualization.]

Step by Step Solution
There are 3 Steps involved in it
Step: 1

See step-by-step solutions with expert insights and AI powered tools for academic success
Step: 2

Step: 3

Ace Your Homework with AI
Get the answers you need in no time with our AI-driven, step-by-step assistance
Get Started


