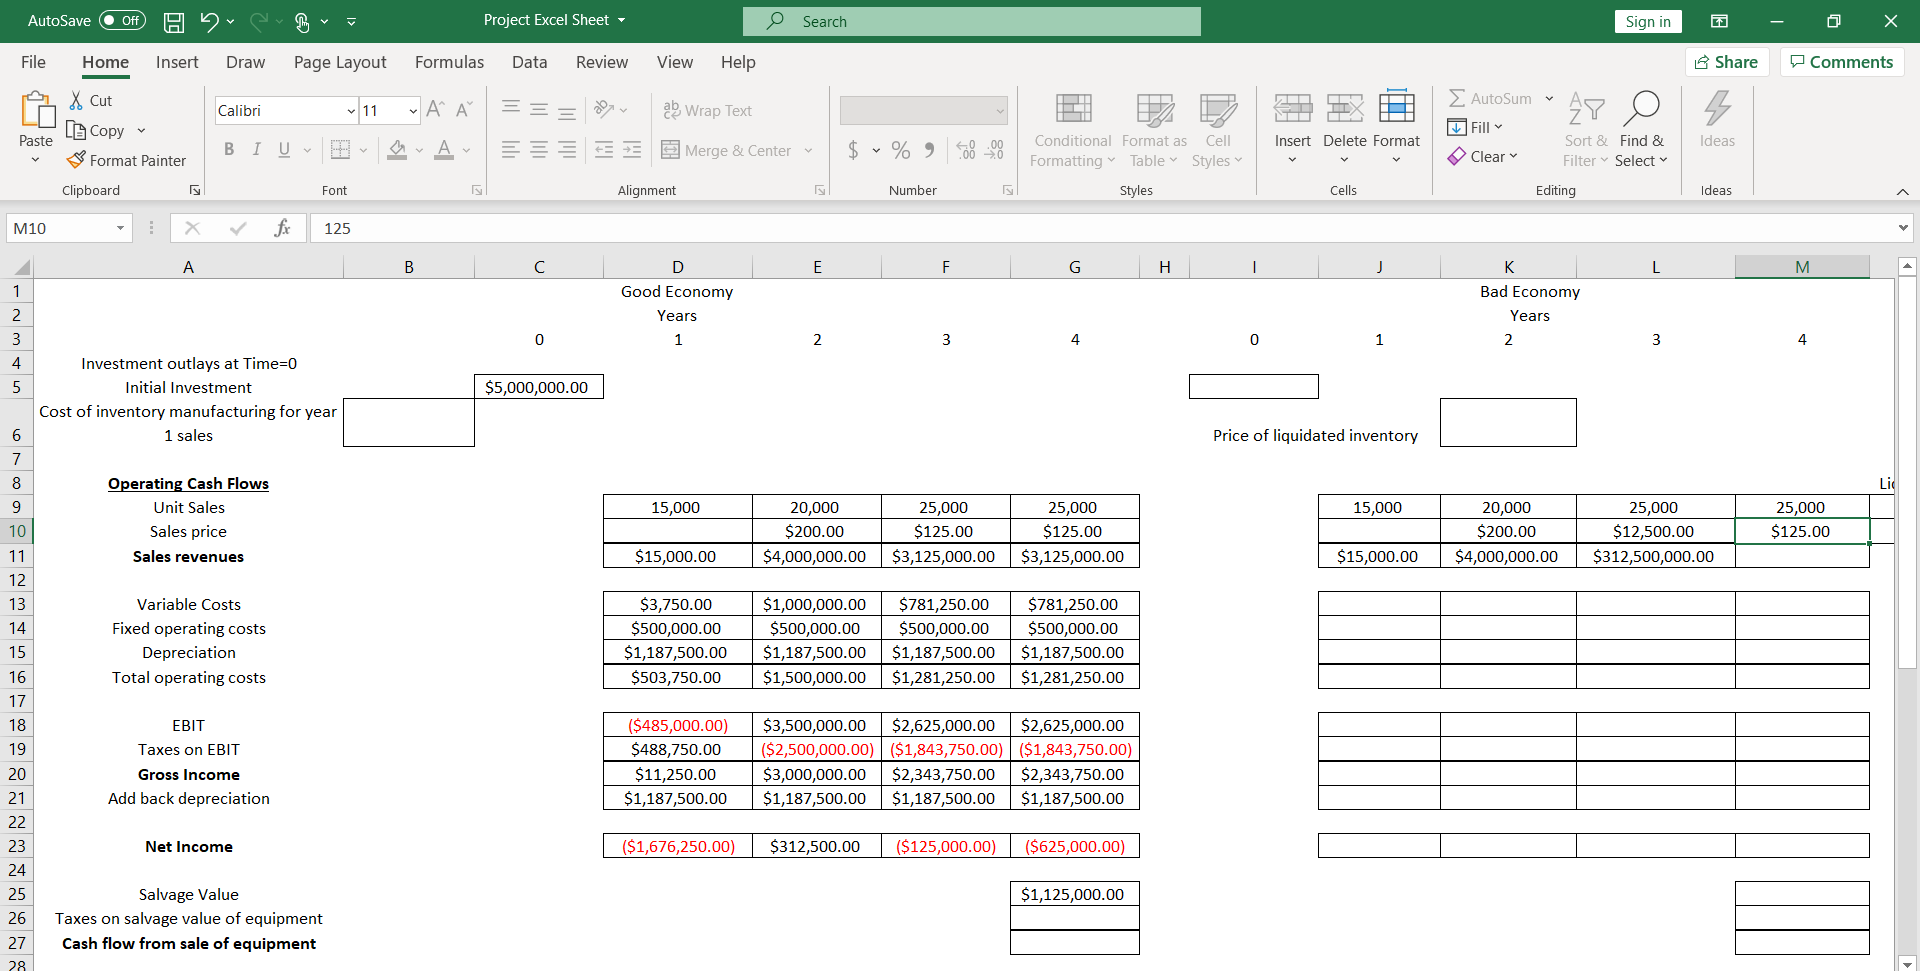
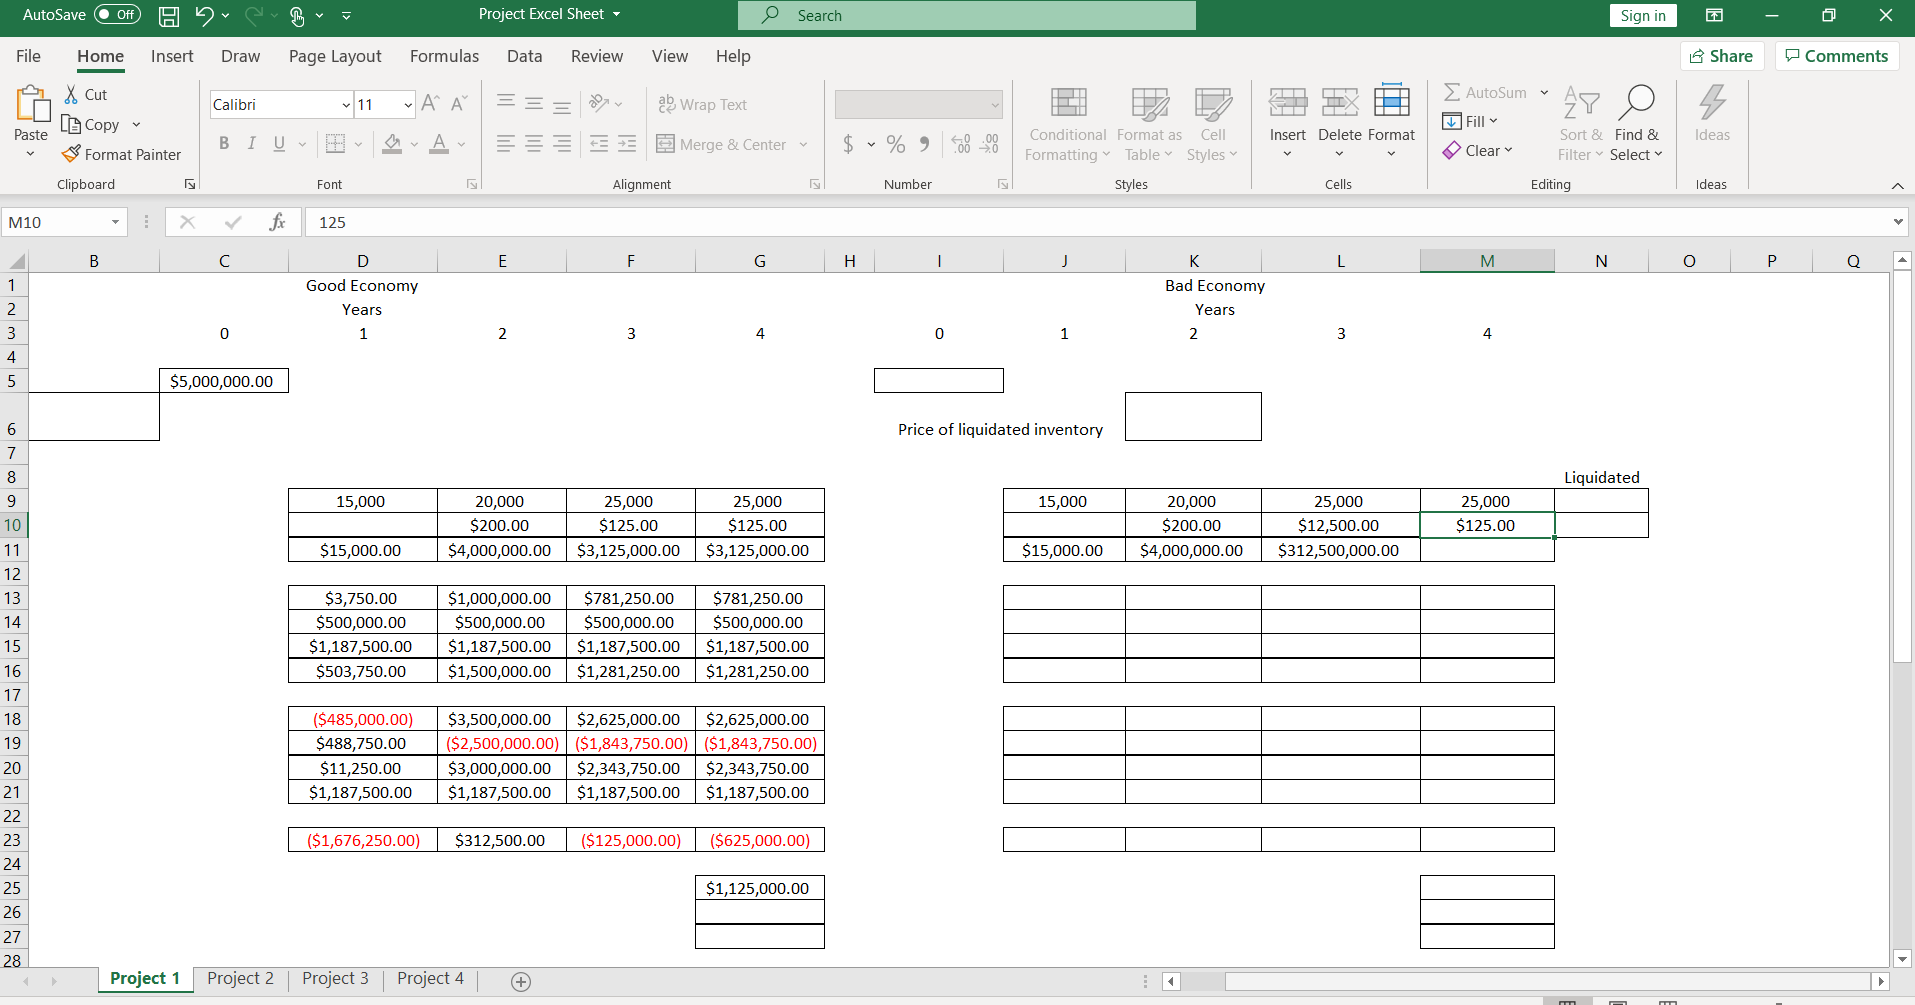
This project is over the course of 4 years. You will need an investment of $5 million in year 0, $2.5 million for equipment, and $2.5 million to produce inventory for year 1. Depreciation is straight line over the 4 years, and the new equipment purchased is sold at the end of the project for a salvage value of $250,000. Fixed costs are $500,000 per year and the variable costs are 25% of sales revenues. Total inventory produced will be 85,000 units. Sales for year 1 are 15,000, year 2 are estimated to be 20,000 units at $200 each and Year 3 and 4 at 25,000 units at $125 each. The estimated tax rate is 35%. There is a 30% chance that the Economy worsens by Year 2. If so, sales are estimated to decrease 25% less than the previous year each year with no change in price after year 2 and inventory to be liquidated will be at a loss of 25%. Can you guys check my math and I need help figuring out formulas for the blank cells/ rest of the problem 

AutoSave Off HD v v Project Excel Sheet Search Sign in - 0 x Comments File Home Insert Draw Page Layout Formulas Data Review View Help Share M & Cut AutoSum v === Dev ab Wrap Text Merge & Center Paste Insert Delete Format Ideas $ % -20 Clear Conditional Format as Cell Formatting Table Styles Styles Sort & Filter Find & Select Calibri - 11 A A BIU - DA Font El fx 125 Alignment Number Cells Editing [ Copy Format Painter Clipboard X Ideas M10 L E / F L G H | I | J | L _M A Good Economy Years K L Bad Economy Years - nm + $5,000,000.00 Investment outlays at Time=0 Initial Investment Cost of inventory manufacturing for year 1 sales Price of liquidated inventory 15,000 15,000 Operating Cash Flows Unit Sales Sales price Sales revenues 20,000 $200.00 $4,000,000.00 25,000 $125.00 $3,125,000.00 25,000 $125.00 $3,125,000.00 20,000 $200.00 $4,000,000.00 25,000 $12,500.00 $312,500,000.00 25,000 $125.00 $15,000.00 $15,000.00 | Variable Costs Fixed operating costs Depreciation Total operating costs $3,750.00 $500,000.00 $1.187.500.00 $503,750.00 $1,000,000.00 $500,000.00 $1,187,500.00 $1,500,000.00 $781.250.00 $500,000.00 $1,187,500.00 $1,281,250.00 $781.250.00 $500,000.00 $1,187,500.00 $1,281,250.00 | EBIT Taxes on EBIT Gross Income Add back depreciation ($485,000.00) $488,750.00 $11,250.00 $1,187,500.00 $3,500,000.00 $2,625,000.00 $2,625,000.00 ($2,500,000.00) ($1,843,750.00) ($1,843,750.00) $3,000,000.00 $2,343,750.00 $2,343,750.00 $1,187,500.00 $1,187,500.00 $1,187,500.00 Net Income | ($1,676,250.00) | $312,500.00 ($125,000.00) ($625,000.00) $1,125,000.00 26 Salvage Value Taxes on salvage value of equipment Cash flow from sale of equipment 27 28 AutoSave Off H Project Excel Sheet - O Search Sign in - File Home Insert Draw Page Layout Formulas Data Review View Help Share Comments Calibri 11 A A ab Wrap Text O X Cut Lo Copy v Format Painter Clipboard == 20 E Paste 4 X A Insert Delete Format AutoSum ~ 47 Fill Sort & Clear Filter BIU - A - S 3 Merge & Center $ PD Conditional Format as Cell Formatting Table Styles Styles % - Find & Select Font Alignment Number Cells Editing Ideas M10 X for 125 D Good Economy Years / E / F G H | I | J | L M N O P Q A Bad Economy Years $5,000,000.00 Price of liquidated inventory Liquidated 15,000 15,000 20,000 $200.00 $4,000,000.00 25,000 $125.00 $3,125,000.00 25,000 $125.00 $3,125,000.00 20,000 $200.00 $4,000,000.00 25,000 $12,500.00 $312,500,000.00 25,000 $125.00 $15,000.00 $15,000.00 $3,750.00 $500,000.00 $1,187,500.00 $503,750.00 $1,000,000.00 $500,000.00 $1,187,500.00 $1,500,000.00 $781,250.00 $500,000.00 $1,187,500.00 $1,281,250.00 $781,250.00 $500,000.00 $1,187,500.00 $1,281,250.00 ($485,000.00) $488,750.00 $11,250.00 $1,187,500.00 $3,500,000.00 $2,625,000.00 $2,625,000.00 ($2,500,000.00) ($1,843,750.00)| ($1,843,750.00) $3,000,000.00 $2,343,750.00 $2,343,750.00 $1,187,500.00 $1,187,500.00 $1,187,500.00 ($1,676,250.00) $312,500.00 ($125,000.00)| ($625,000.00) $1,125,000.00 Project 1 Project 2 Project 3 Project 4 AutoSave Off HD v v Project Excel Sheet Search Sign in - 0 x Comments File Home Insert Draw Page Layout Formulas Data Review View Help Share M & Cut AutoSum v === Dev ab Wrap Text Merge & Center Paste Insert Delete Format Ideas $ % -20 Clear Conditional Format as Cell Formatting Table Styles Styles Sort & Filter Find & Select Calibri - 11 A A BIU - DA Font El fx 125 Alignment Number Cells Editing [ Copy Format Painter Clipboard X Ideas M10 L E / F L G H | I | J | L _M A Good Economy Years K L Bad Economy Years - nm + $5,000,000.00 Investment outlays at Time=0 Initial Investment Cost of inventory manufacturing for year 1 sales Price of liquidated inventory 15,000 15,000 Operating Cash Flows Unit Sales Sales price Sales revenues 20,000 $200.00 $4,000,000.00 25,000 $125.00 $3,125,000.00 25,000 $125.00 $3,125,000.00 20,000 $200.00 $4,000,000.00 25,000 $12,500.00 $312,500,000.00 25,000 $125.00 $15,000.00 $15,000.00 | Variable Costs Fixed operating costs Depreciation Total operating costs $3,750.00 $500,000.00 $1.187.500.00 $503,750.00 $1,000,000.00 $500,000.00 $1,187,500.00 $1,500,000.00 $781.250.00 $500,000.00 $1,187,500.00 $1,281,250.00 $781.250.00 $500,000.00 $1,187,500.00 $1,281,250.00 | EBIT Taxes on EBIT Gross Income Add back depreciation ($485,000.00) $488,750.00 $11,250.00 $1,187,500.00 $3,500,000.00 $2,625,000.00 $2,625,000.00 ($2,500,000.00) ($1,843,750.00) ($1,843,750.00) $3,000,000.00 $2,343,750.00 $2,343,750.00 $1,187,500.00 $1,187,500.00 $1,187,500.00 Net Income | ($1,676,250.00) | $312,500.00 ($125,000.00) ($625,000.00) $1,125,000.00 26 Salvage Value Taxes on salvage value of equipment Cash flow from sale of equipment 27 28 AutoSave Off H Project Excel Sheet - O Search Sign in - File Home Insert Draw Page Layout Formulas Data Review View Help Share Comments Calibri 11 A A ab Wrap Text O X Cut Lo Copy v Format Painter Clipboard == 20 E Paste 4 X A Insert Delete Format AutoSum ~ 47 Fill Sort & Clear Filter BIU - A - S 3 Merge & Center $ PD Conditional Format as Cell Formatting Table Styles Styles % - Find & Select Font Alignment Number Cells Editing Ideas M10 X for 125 D Good Economy Years / E / F G H | I | J | L M N O P Q A Bad Economy Years $5,000,000.00 Price of liquidated inventory Liquidated 15,000 15,000 20,000 $200.00 $4,000,000.00 25,000 $125.00 $3,125,000.00 25,000 $125.00 $3,125,000.00 20,000 $200.00 $4,000,000.00 25,000 $12,500.00 $312,500,000.00 25,000 $125.00 $15,000.00 $15,000.00 $3,750.00 $500,000.00 $1,187,500.00 $503,750.00 $1,000,000.00 $500,000.00 $1,187,500.00 $1,500,000.00 $781,250.00 $500,000.00 $1,187,500.00 $1,281,250.00 $781,250.00 $500,000.00 $1,187,500.00 $1,281,250.00 ($485,000.00) $488,750.00 $11,250.00 $1,187,500.00 $3,500,000.00 $2,625,000.00 $2,625,000.00 ($2,500,000.00) ($1,843,750.00)| ($1,843,750.00) $3,000,000.00 $2,343,750.00 $2,343,750.00 $1,187,500.00 $1,187,500.00 $1,187,500.00 ($1,676,250.00) $312,500.00 ($125,000.00)| ($625,000.00) $1,125,000.00 Project 1 Project 2 Project 3 Project 4


