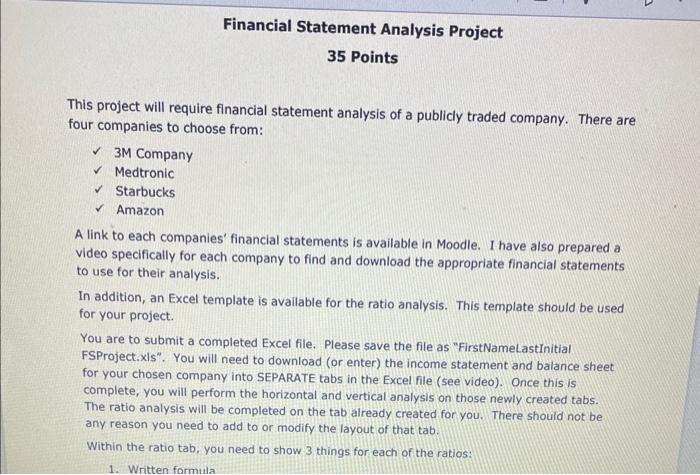
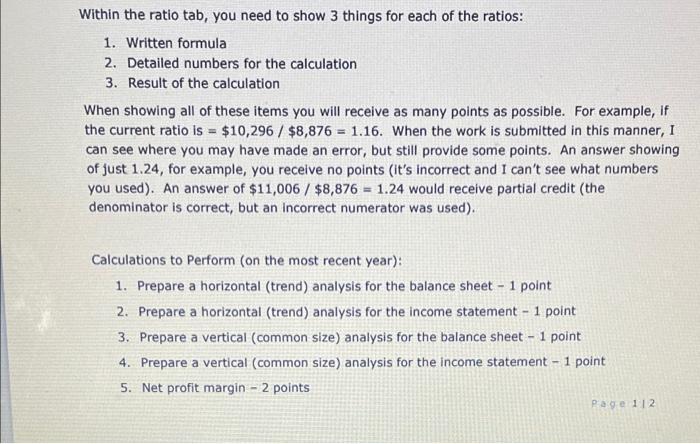
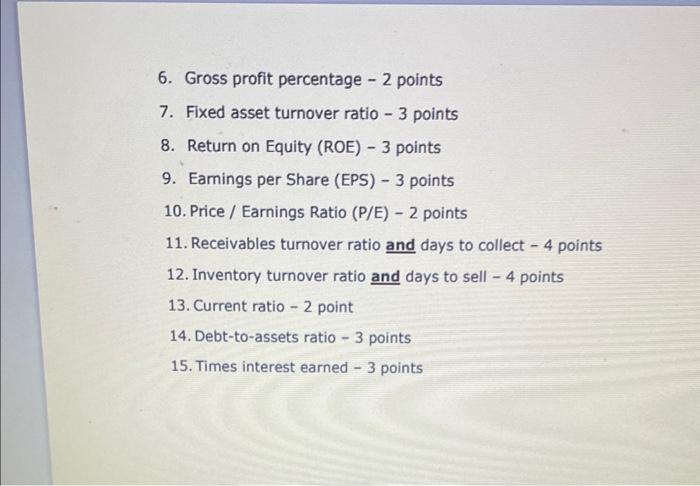
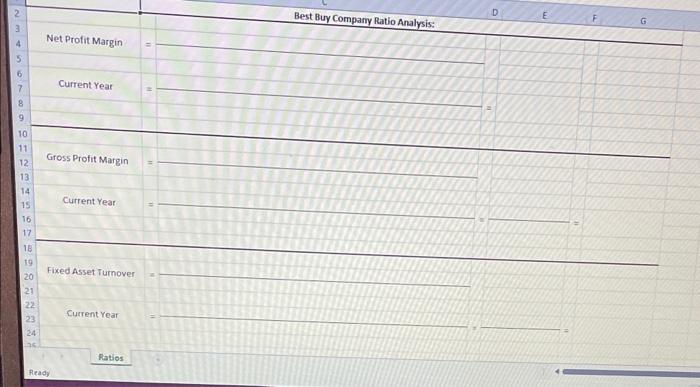
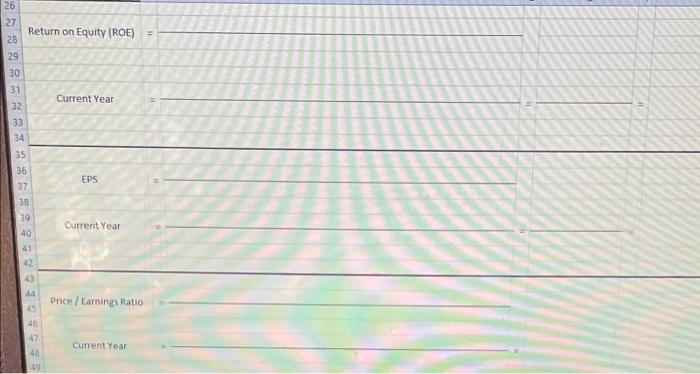
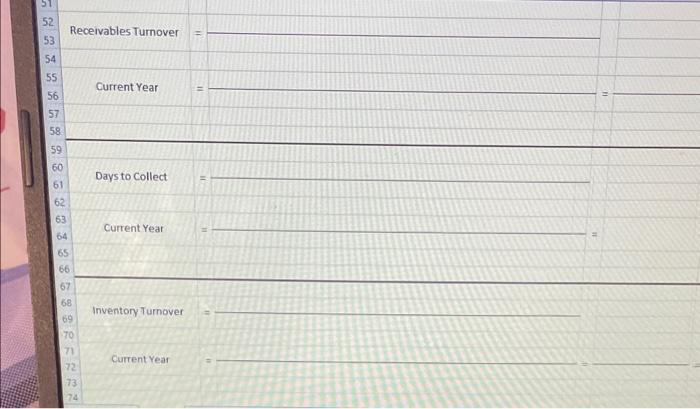
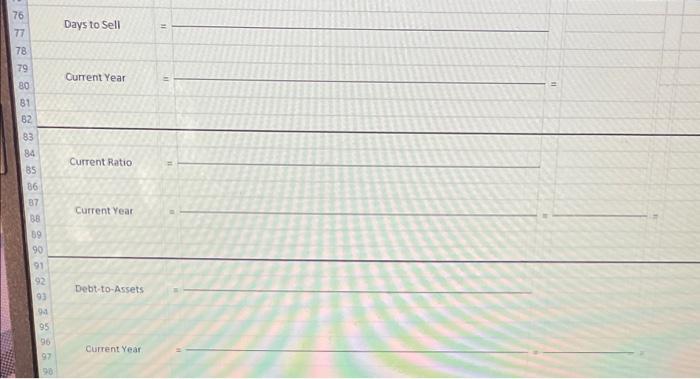
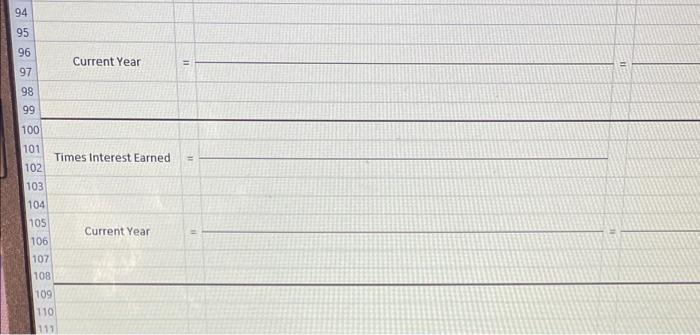
This project will require financial statement analysis of a publicly traded company. There are four companies to choose from: 3M Company Medtronic Starbucks Amazon A link to each companies' financial statements is available in Moodle. I have also prepared a video specifically for each company to find and download the appropriate financial statements to use for their analysis. In addition, an Excel template is available for the ratio analysis. This template should be used for your project. You are to submit a completed Excel file. Please save the file as "FirstNameLastInitial FSProject.xis". You will need to download (or enter) the income statement and balance sheet for your chosen company into SEPARATE tabs in the Excel file (see video). Once this is complete, you will perform the horizontal and vertical analysis on those newly created tabs. The ratio analysis will be completed on the tab already created for you. There should not be any reason you need to add to or modify the layout of that tab. Within the ratio tab, you need to show 3 things for each of the ratios: 1. Written formula Within the ratio tab, you need to show 3 things for each of the ratios: 1. Written formula 2. Detailed numbers for the calculation 3. Result of the calculation When showing all of these items you will receive as many points as possible. For example, if the current ratio is =$10,296/$8,876=1.16. When the work is submitted in this manner, I can see where you may have made an error, but still provide some points. An answer showing of just 1.24, for example, you receive no points (it's incorrect and I can't see what numbers you used). An answer of $11,006/$8,876=1.24 would receive partial credit (the denominator is correct, but an incorrect numerator was used). Calculations to Perform (on the most recent year): 1. Prepare a horizontal (trend) analysis for the balance sheet - 1 point 2. Prepare a horizontal (trend) analysis for the income statement - 1 point 3. Prepare a vertical (common size) analysis for the balance sheet - 1 point 4. Prepare a vertical (common size) analysis for the income statement - 1 point 5. Net profit margin 2 points 6. Gross profit percentage 2 points 7. Fixed asset turnover ratio 3 points 8. Return on Equity (ROE) 3 points 9. Earnings per Share (EPS) 3 points 10. Price / Earnings Ratio (P/E) - 2 points 11. Receivables turnover ratio and days to collect - 4 points 12. Inventory turnover ratio and days to sell 4 points 13. Current ratio 2 point 14. Debt-to-assets ratio 3 points 15. Times interest earned 3 points Fixed Asset Turnover = Eurrent Year : = Ratios 29 30 \begin{tabular}{r|l} 31 \\ 32 & Current Year \\ 33 \end{tabular} 33 34 35 36 EPS \begin{tabular}{r|l} 37 & 23 \\ 39 & Current Year = \\ 40 & = \end{tabular} 41 42 43 44. Price / Earnings Ratio 45 47. Current Year = Receivables Turnover = CurrentYear = Days to Collect = Current Year = Inventory Turnover = Current Year 81 82 83 84 Current Ratio = 867 8. 87 Cutrentyear = = 69 90 91 92. Debt-to-Assets = 93 95 96 Current year = \begin{tabular}{l|l} 94 & \\ 95 & \\ 96 & Current Year = \\ 97 & = \end{tabular} 98 99 100 101 Times Interest Earned = 102 103 103 105 Current Year = 106 107 108 109 110 This project will require financial statement analysis of a publicly traded company. There are four companies to choose from: 3M Company Medtronic Starbucks Amazon A link to each companies' financial statements is available in Moodle. I have also prepared a video specifically for each company to find and download the appropriate financial statements to use for their analysis. In addition, an Excel template is available for the ratio analysis. This template should be used for your project. You are to submit a completed Excel file. Please save the file as "FirstNameLastInitial FSProject.xis". You will need to download (or enter) the income statement and balance sheet for your chosen company into SEPARATE tabs in the Excel file (see video). Once this is complete, you will perform the horizontal and vertical analysis on those newly created tabs. The ratio analysis will be completed on the tab already created for you. There should not be any reason you need to add to or modify the layout of that tab. Within the ratio tab, you need to show 3 things for each of the ratios: 1. Written formula Within the ratio tab, you need to show 3 things for each of the ratios: 1. Written formula 2. Detailed numbers for the calculation 3. Result of the calculation When showing all of these items you will receive as many points as possible. For example, if the current ratio is =$10,296/$8,876=1.16. When the work is submitted in this manner, I can see where you may have made an error, but still provide some points. An answer showing of just 1.24, for example, you receive no points (it's incorrect and I can't see what numbers you used). An answer of $11,006/$8,876=1.24 would receive partial credit (the denominator is correct, but an incorrect numerator was used). Calculations to Perform (on the most recent year): 1. Prepare a horizontal (trend) analysis for the balance sheet - 1 point 2. Prepare a horizontal (trend) analysis for the income statement - 1 point 3. Prepare a vertical (common size) analysis for the balance sheet - 1 point 4. Prepare a vertical (common size) analysis for the income statement - 1 point 5. Net profit margin 2 points 6. Gross profit percentage 2 points 7. Fixed asset turnover ratio 3 points 8. Return on Equity (ROE) 3 points 9. Earnings per Share (EPS) 3 points 10. Price / Earnings Ratio (P/E) - 2 points 11. Receivables turnover ratio and days to collect - 4 points 12. Inventory turnover ratio and days to sell 4 points 13. Current ratio 2 point 14. Debt-to-assets ratio 3 points 15. Times interest earned 3 points Fixed Asset Turnover = Eurrent Year : = Ratios 29 30 \begin{tabular}{r|l} 31 \\ 32 & Current Year \\ 33 \end{tabular} 33 34 35 36 EPS \begin{tabular}{r|l} 37 & 23 \\ 39 & Current Year = \\ 40 & = \end{tabular} 41 42 43 44. Price / Earnings Ratio 45 47. Current Year = Receivables Turnover = CurrentYear = Days to Collect = Current Year = Inventory Turnover = Current Year 81 82 83 84 Current Ratio = 867 8. 87 Cutrentyear = = 69 90 91 92. Debt-to-Assets = 93 95 96 Current year = \begin{tabular}{l|l} 94 & \\ 95 & \\ 96 & Current Year = \\ 97 & = \end{tabular} 98 99 100 101 Times Interest Earned = 102 103 103 105 Current Year = 106 107 108 109 110
