Answered step by step
Verified Expert Solution
Link Copied!

Question

1 Approved Answer

This question: 1 pa The following table shows the hot dogs bought from a street vendor over the course of eight days (Demand) Also shown
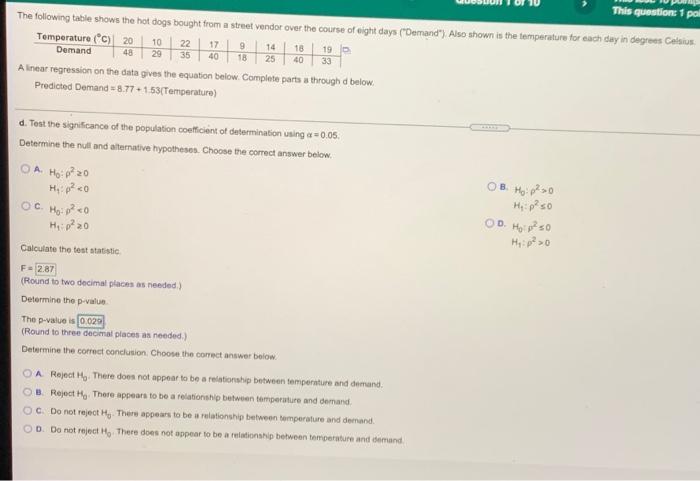
image text in transcribed
This question: 1 pa The following table shows the hot dogs bought from a street vendor over the course of eight days ("Demand") Also shown is the temperature for each day in degrees Celsius Temperature ( C) 20 | 10 22 17 9. 14 18 19 Demand 48 29 35 40 18 25 40 33 A linear regression on the data gives the equation below. Complete parts a through d below. Predicted Demand = 8.77 + 1 53(Temperature) d. Test the significance of the population coefficient of determination using a = 0.05. Determine the null and alternative hypotheses. Choose the correct answer below, OA Hoep 20 OB HP20 Hip SO OC Hop -0 OD. Ho PisO Hip- 20 Calculate the test statistic F- 2.87 (Round to two decimal places as needed.) Determine the p-value. The p-value is 0:029 (Round to three decimal places as needed.) Determine the correct conclusion, Choose the correct answer bolow. O A Reject Hy. There does not appear to be a relationship between temperature and demand. O B. Reject He. There appears to be a relationship between temperature and demand O C. Do not reject Hy. There appears to be a relationship between tomporature and demand. @ D. Do not reject Hy. There does not appear to be a relationship between terriperature and demand

Step by Step Solution

There are 3 Steps involved in it

Step: 1

blur-text-image

Get Instant Access to Expert-Tailored Solutions

See step-by-step solutions with expert insights and AI powered tools for academic success

Step: 2

blur-text-image

Step: 3

blur-text-image

Ace Your Homework with AI

Get the answers you need in no time with our AI-driven, step-by-step assistance

Get Started

Recommended Textbook for

More Books

Students also viewed these Mathematics questions

Question

Understanding Group Leadership Culture and Group Leadership

Answered: 1 week ago