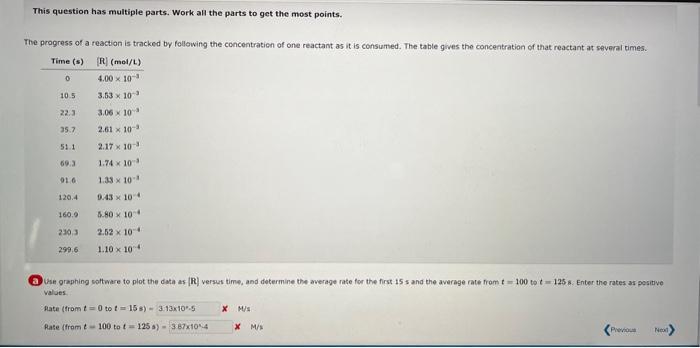
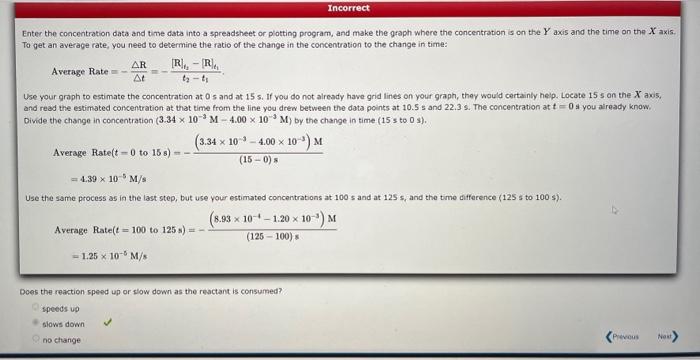
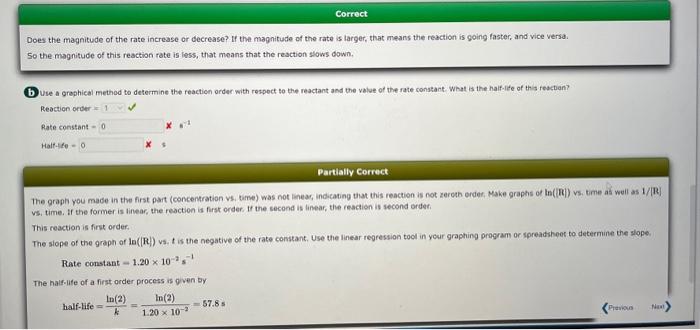
This question has multiple parts. Work all the parts to get the most points. The progress of a reaction is tracked by following the concentration of one reactant as it is consumed. The table gives the concentration of that reactant at several times. (a) Use graphing wottware to plot the data as [R] versus time, and determine the average rate for the first is s and the average rate from t=100 to t=125 s. Enter the rates as pesitive values. fate (tromt=0 to t=15s)= M/s Rate ( fram t=100 to t=125s)= x M M Enter the concentration data and time data into a spreadsheet or plotting program, and make the qraph where the concentration is on the Y axis and the time on the X axis. To get an average rate, you need to determine the ratio of the change in the concentration to the change in time: AverageRate=tR=t2t1[R]t2[R]t1. Use your groph to estimate the concentration at 0 s and at 15 s. If you do not already have grid lines on your graph, they would certainly help. Locate 15 s an the X axis. and read the estimated concentration at that time from the line you drew between the data points at 10.5s and 22.3s. The concentration at t=0s you already know. Divide the change in concentration (3.34103M4.00103M) by the change in time (15 s to 0s). AverageRate(t0to15s)=(150)s(3.341034.00103)M=4.39105M/s Use the same process as in the last step, but use your estimated concentrations at 100 s and at 125 s, and the time difference (125 s to 100 s). AverageRate(t=100to125s)=(125100)s(8.931011.20103)M=1.25105M/s Does the reaction speed up or slow down as the reactant is consumed? ipeeds up blaws down no change Does the magnitude of the rate increase or decrease? If the magnitude of the rate is larger, that means the reaction is going faster, and vice versa. So the magnitude of this reaction rate is less, that means that the reaction slows down. (b) Use a graphical method to determine the reactich order with respect to the reactant and the value of the rate constant: What is the half-ile of this reactian? Reactionorder-Rateconstant-x=1Haltelte= Partially Correct The graph you made in the first part (concentration vs. time) was not linear, indicating that this reaction is not zereth erder, Make graphs of ln(in]) vs. time as wuil as 1/[R]. v5, time. If the former is linear, the reaction is first order, If the second is linear, the reaction is second ordef. This reaction is first order. The slope of the graph of la ((R) vs. t is the negative of the rate constant. Use the linear regression tocl in year graphing program or spreadshee to determine the slope. Rateconstant=1.20102s1 The halfelife of a first order process is qven by half-life=kln(2)=1.20102ln(2)=57.8s


