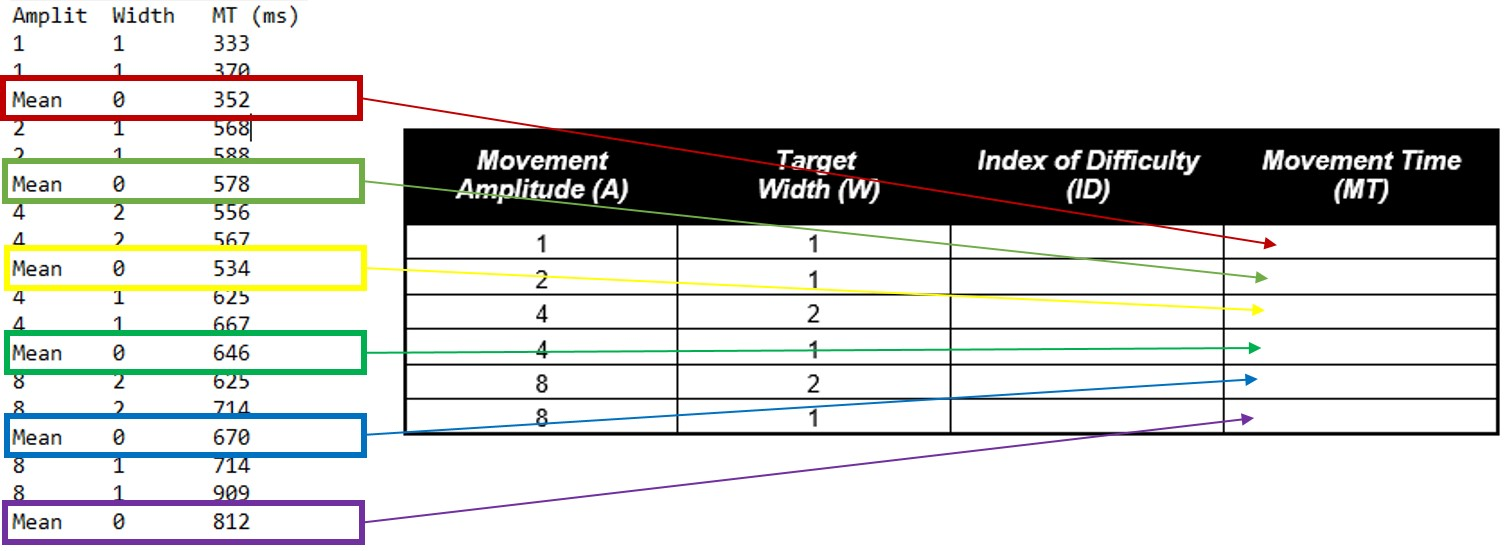
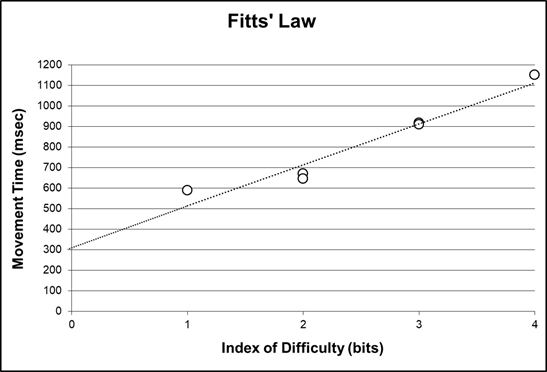
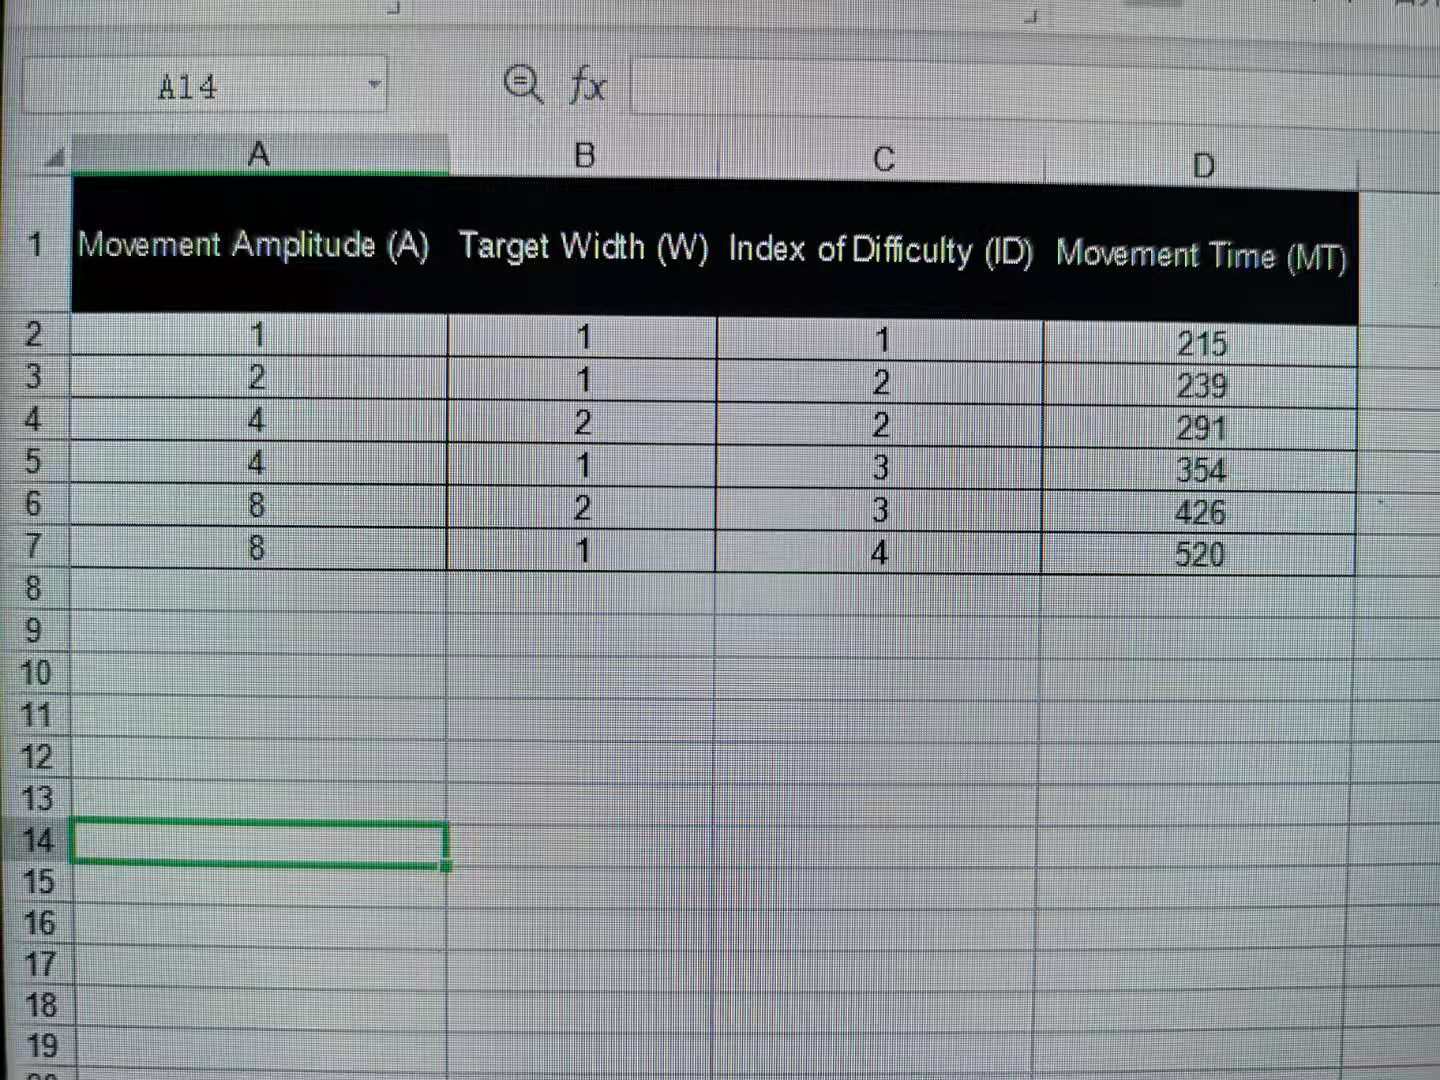
This question is about Fitts' Law - Speed Accuracy Trade-off Using Excel, build a plot similar to that shown below. Note, select XY Scatterplot and
This question is about Fitts' Law - Speed Accuracy Trade-off
Using Excel, build a plot similar to that shown below. Note, select XY Scatterplot and place ID on the X-axis and MT on the Y-axis. To determine the slope and y-intercept, right-click on one of the data points on the graph and select "Add Trend line". When the "Format Trend line" box appears, select "Linear", add a check mark to "Display Equation on Chart" and then select and enter the number "1", where it says "Forecast" "Backward" (this will make the linear trend line go all the way to the y-axis). Recall that any straight line corresponds to the general equation y = mx +b, in which "m" = the slope of the line and "b" = the y-intercept. Record your "m" and "b" values from the equation shown on the graph.
I will provide a picture of my data, all you need to do is to build a graph similar to the example I provide below, and then follow the guide above, record "m" and "b" values from the equation shown on the graph. Thank you!!!


Step by Step Solution
There are 3 Steps involved in it
Step: 1

See step-by-step solutions with expert insights and AI powered tools for academic success
Step: 2

Step: 3

Ace Your Homework with AI
Get the answers you need in no time with our AI-driven, step-by-step assistance
Get Started


