

Question
This question is based on the Sierpinski Triangle. The figure below shows the percentage of total even entries and total odd entries through columns 10,20,30...1000
This question is based on the Sierpinski Triangle.
The figure below shows the percentage of total even entries and total odd entries through columns 10,20,30...1000
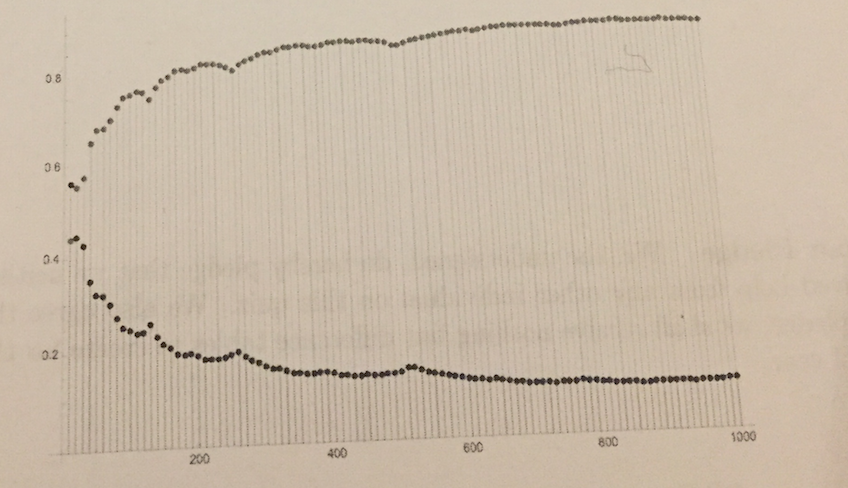
To generate that figure of the sideways parabola, I have this code:
ListPlot[ { Table[ { col, 100. Total[ Flatten[ Table[ If[ EvenQ[Binomial[n, k]], 1, 0 ], {n, 0, col, 1}, {k, 0, n, 1} ], 1 ] ]/((col + 1) (col + 2)/2) }, {col, 10, 1000, 5} ], Table[ { col, 100. Total[ Flatten[ Table[ If[ OddQ[Binomial[n, k]], 1, 0 ], {n, 0, col, 1}, {k, 0, n, 1} ], 1 ] ]/((col + 1) (col + 2)/2) }, {col, 10, 1000, 5} ] }, Filling -> Axis, PlotStyle -> {Blue, Orange}, ImageSize -> Automatic ]
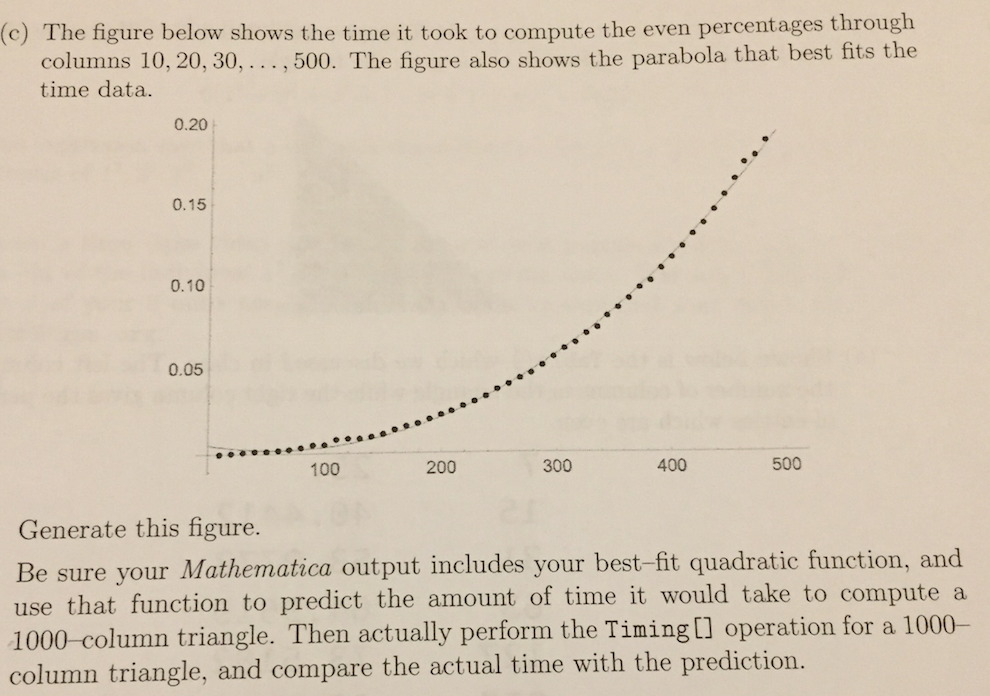
How can I generate the figure that shows the time it took to compute the even percentages through columns 10,...,500 and also show the parabola that best fits teh time data?
Also once I have that best-fit quadratic, how can I predict the time it would take to generate 1000 column?
(c) The figure below shows the time it took to compute the even percentages through , 500. The figure also shows the parabola that best fits the columns 10, 20, 30 time data. ,... 0.20 0.15 0.10 0.05 100 200 300 400 500 Generate this figure Be sure your Mathematica output includes your best-fit quadratic function, and use that function to predict the amount of time it would take to compute a 1000-column triangle. Then actually perform the Timing[] operation for a 1000 column triangle, and compare the actual time with the prediction 0 8 0 6 0.4 0.2 ess 200 400 600 800 1000Step by Step Solution
There are 3 Steps involved in it
Step: 1

Get Instant Access to Expert-Tailored Solutions
See step-by-step solutions with expert insights and AI powered tools for academic success
Step: 2

Step: 3
Ace Your Homework with AI
Get the answers you need in no time with our AI-driven, step-by-step assistance
Get Started
Temporal Databases Research And Practice Lncs 1399
Authors: Opher Etzion ,Sushil Jajodia ,Suryanarayana Sripada
1st Edition
3540645195, 978-3540645191