

Answered step by step
Verified Expert Solution
Question
1 Approved Answer
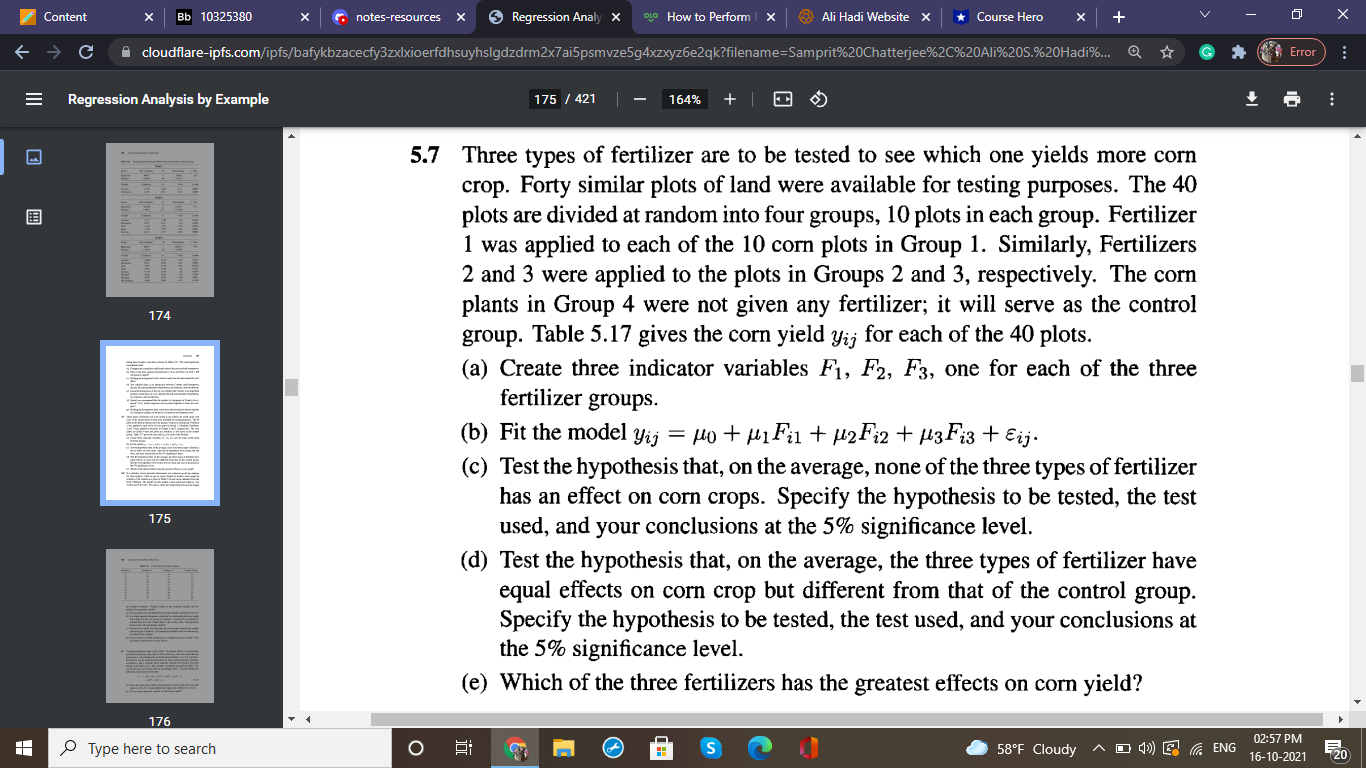
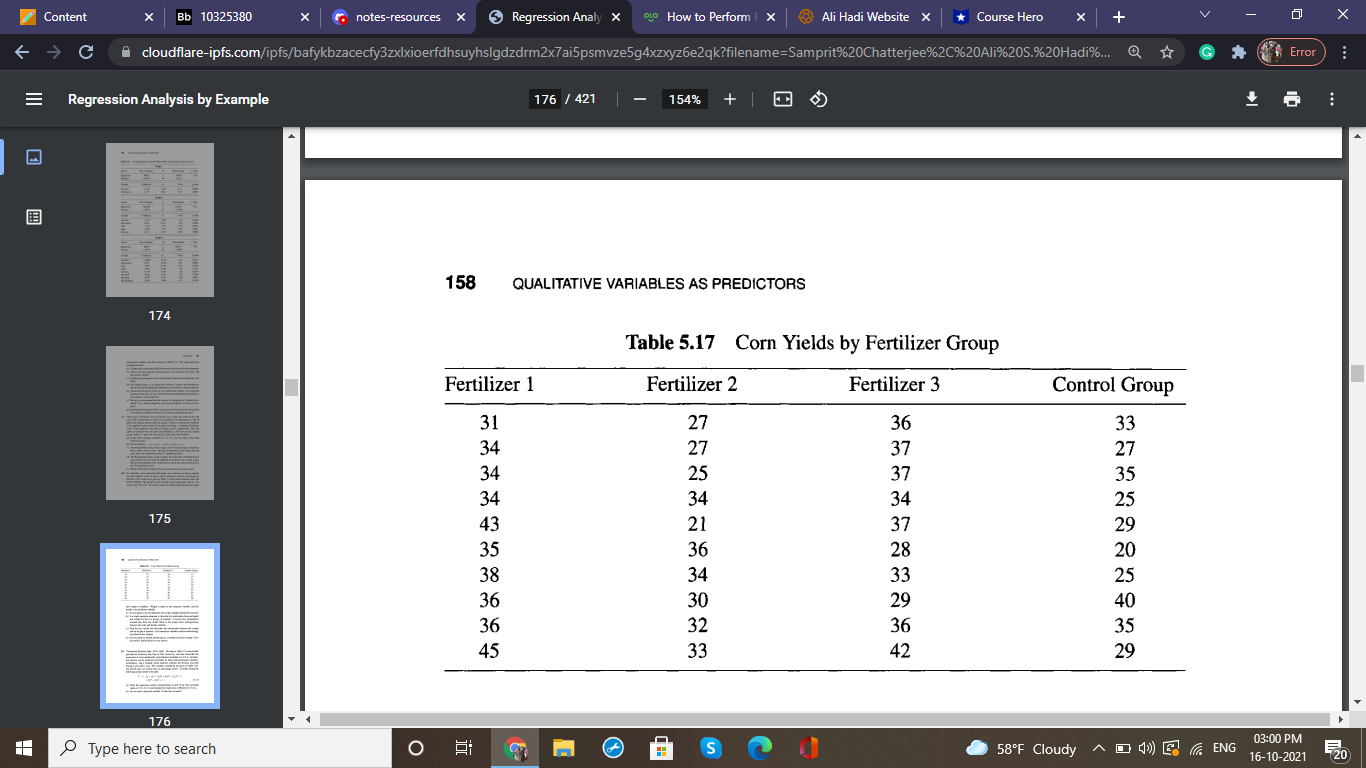
This question is from the book regression analysis by example question 5.7 and table is attached in the second picture howiu F'erfom 2-: All HadiWehsite
This question is from the book regression analysis by example
question 5.7 and table is attached in the
second picture
Step by Step Solution
There are 3 Steps involved in it
Step: 1

Get Instant Access to Expert-Tailored Solutions
See step-by-step solutions with expert insights and AI powered tools for academic success
Step: 2

Step: 3
Ace Your Homework with AI
Get the answers you need in no time with our AI-driven, step-by-step assistance
Get Started
Calculus An Applied Approach
Authors: Ron Larson, Dennis J McKenzie, Larson/Edwards, Bruce H Edwards
7th Edition
1111809720, 9781111809720