This question is from the textbook Problem Solving Cases in Microsoft Access and Excel, Edition 16.
Prepare a spreadsheet following the instructions in the case. Your spreadsheet should contain three named tabs, including: (1) Finances, (2) Without Scenario, and (3) With Scenario. All three tabbed worksheets must contain appropriate live cells.
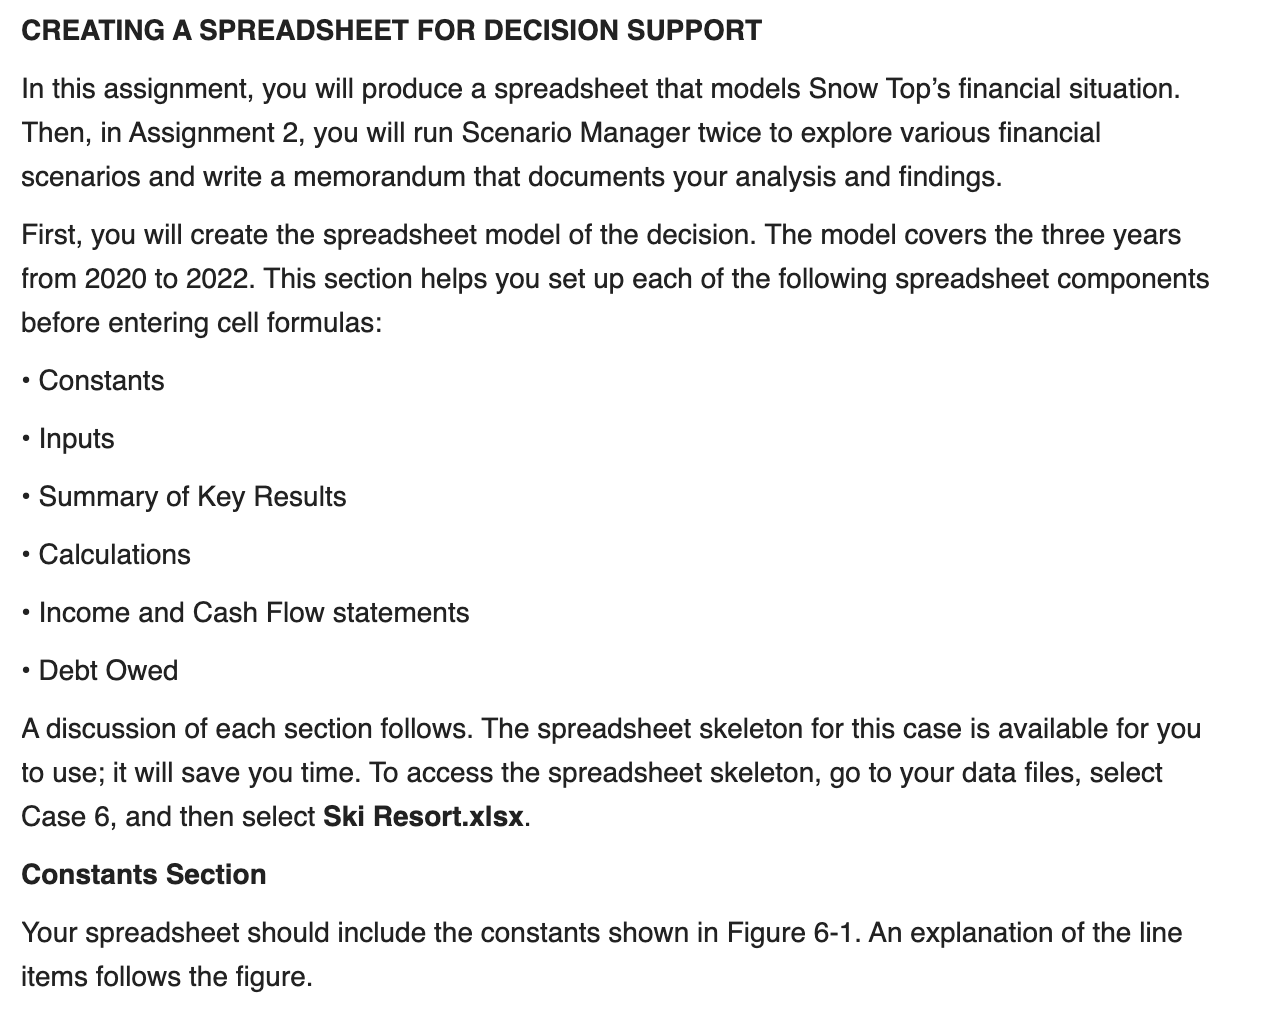
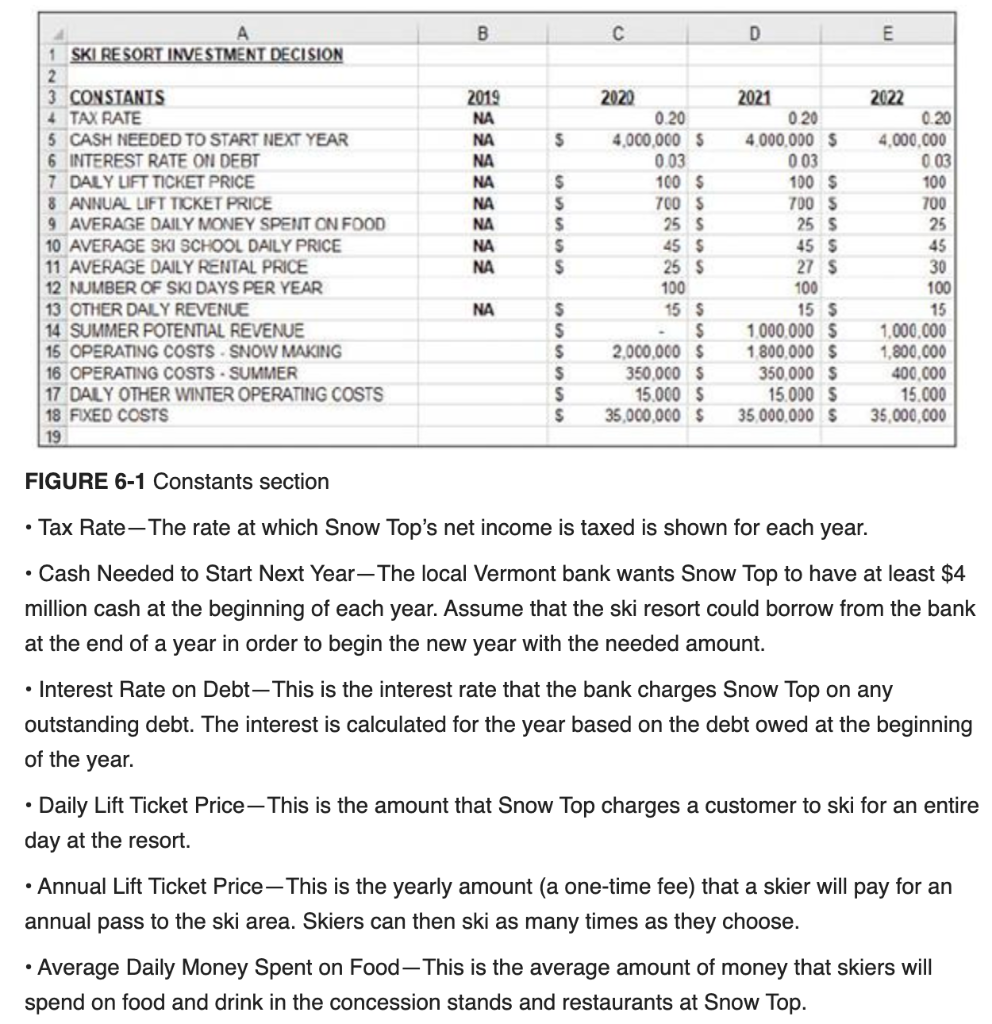
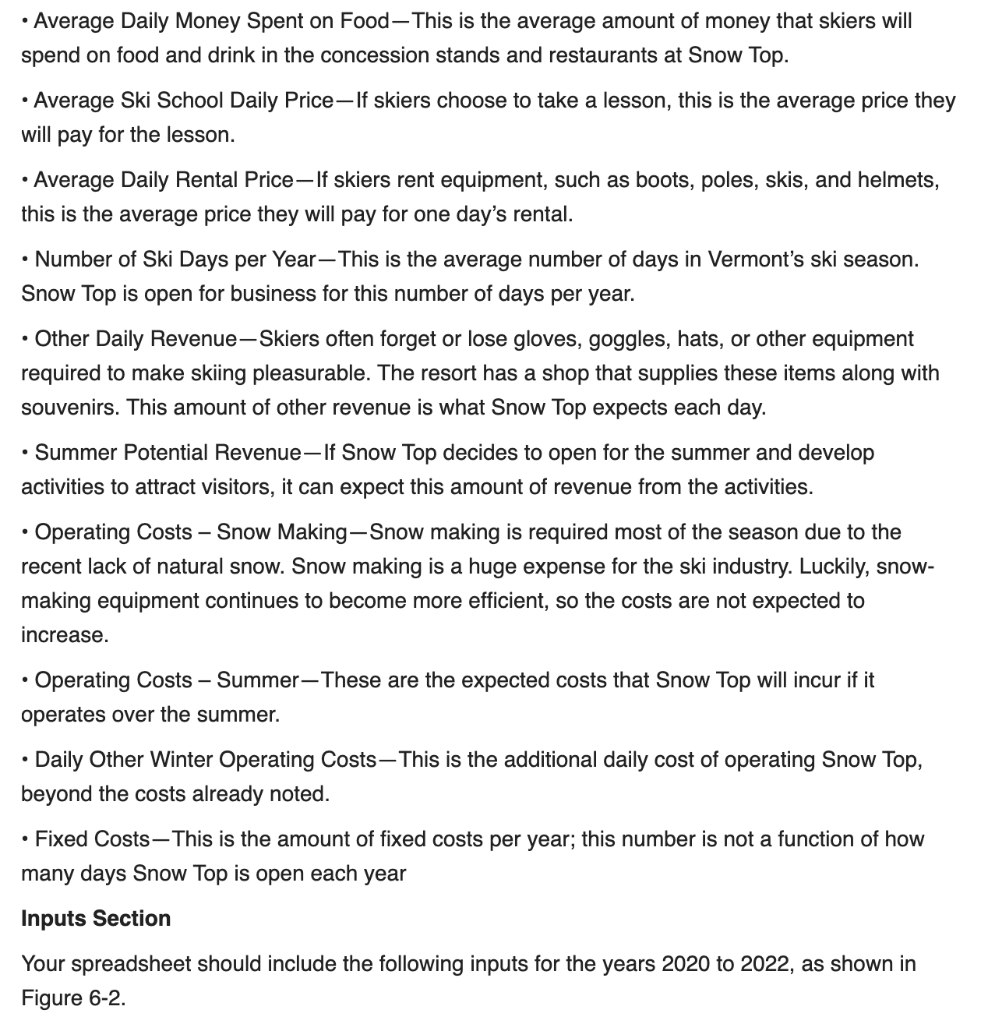
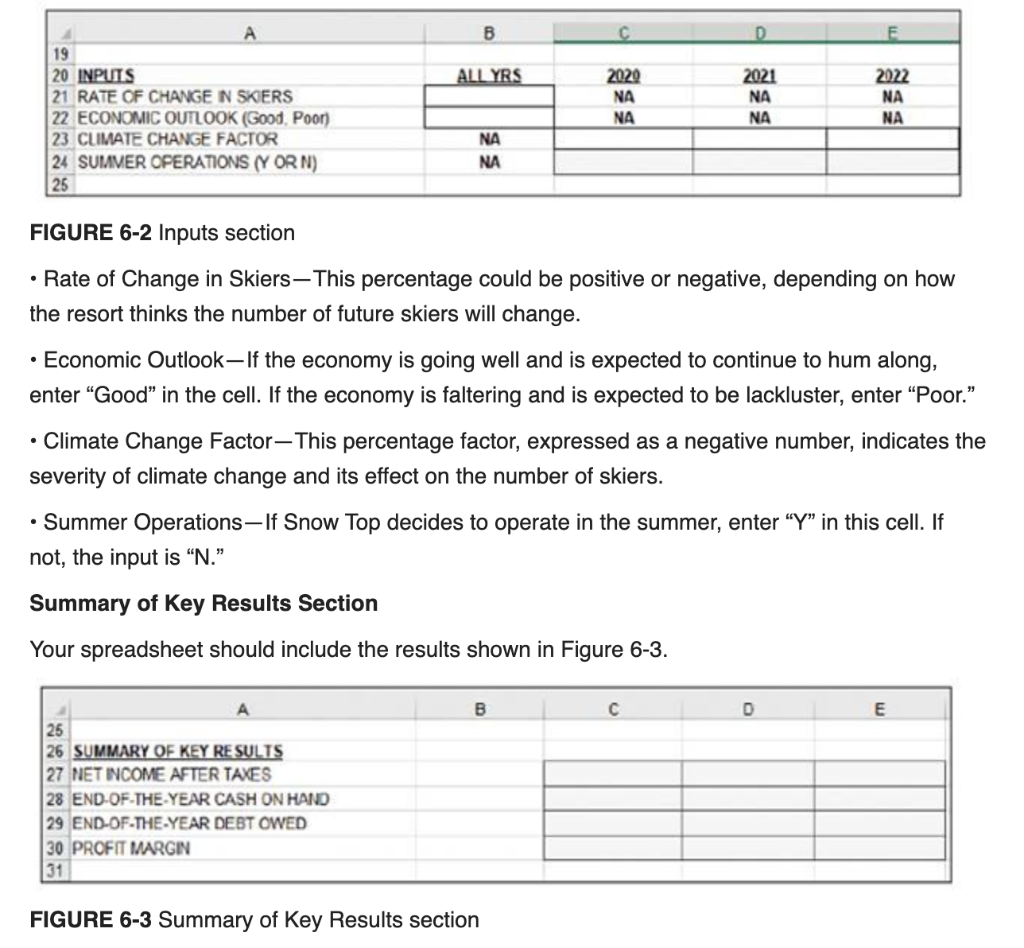
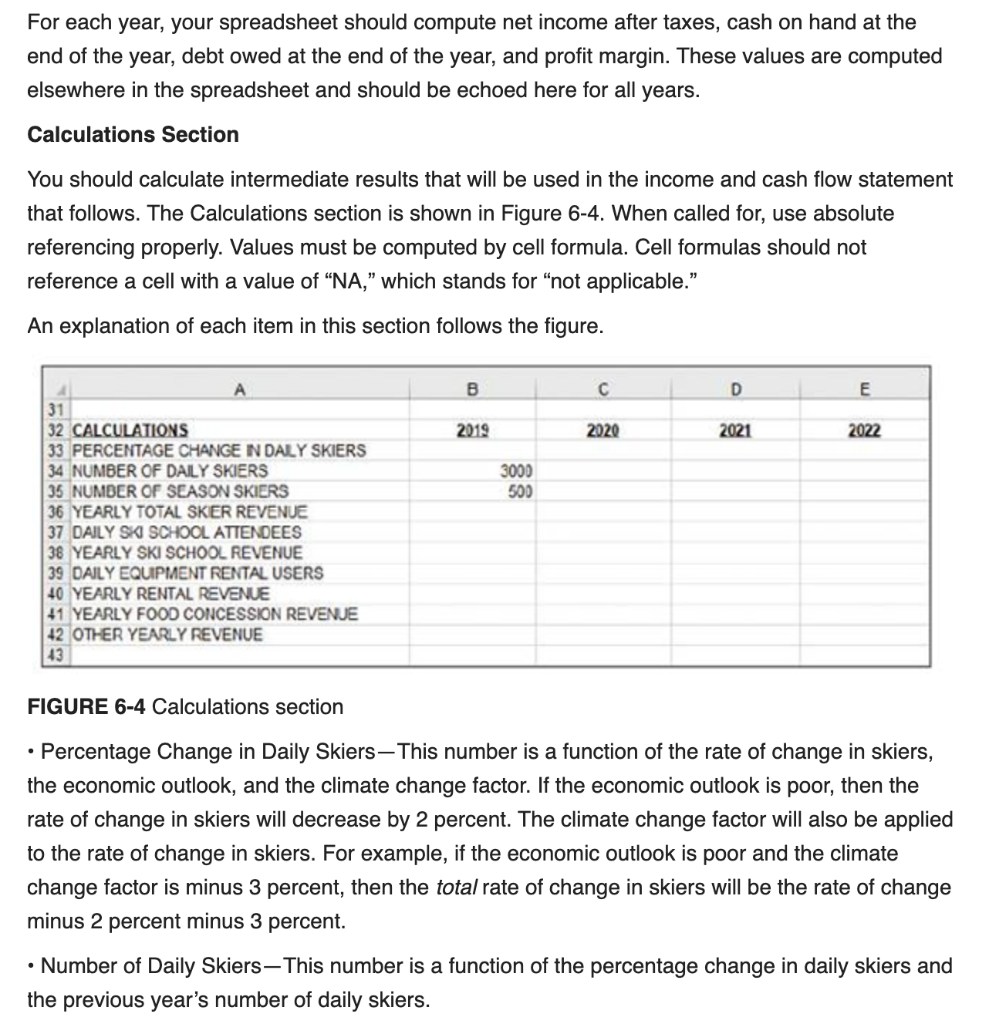
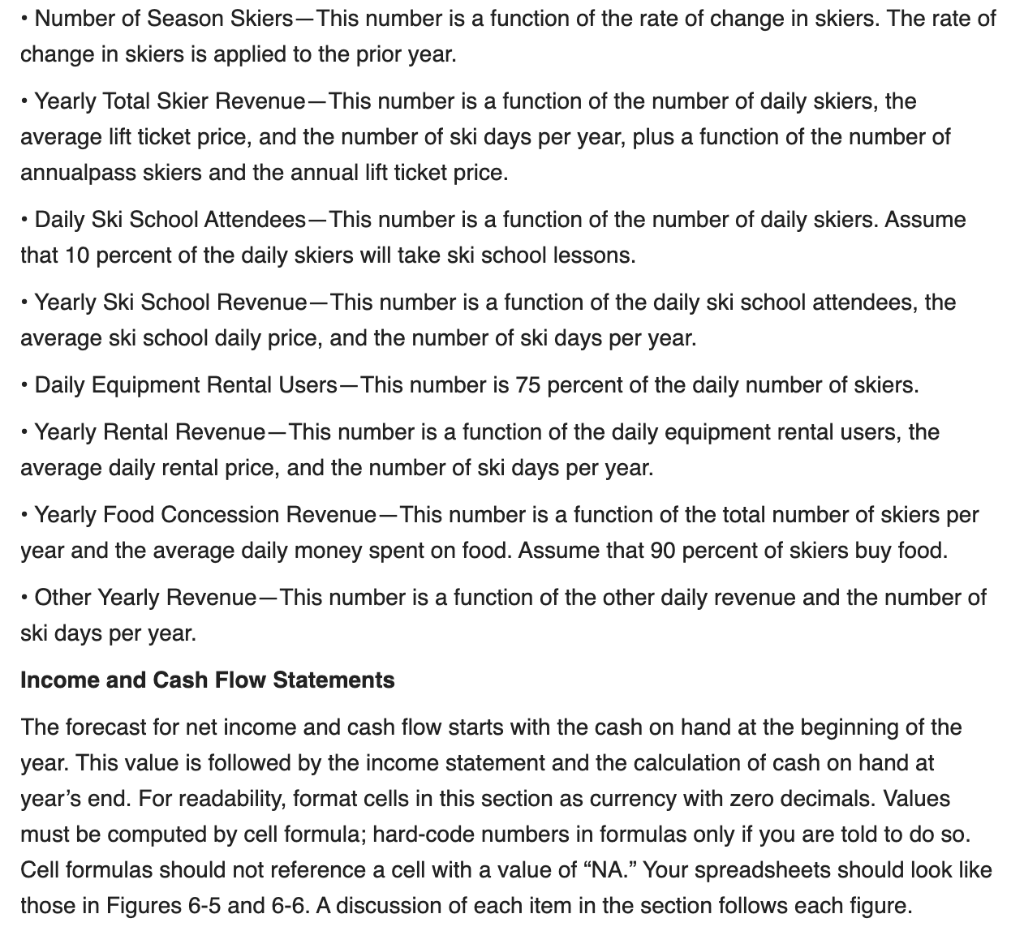
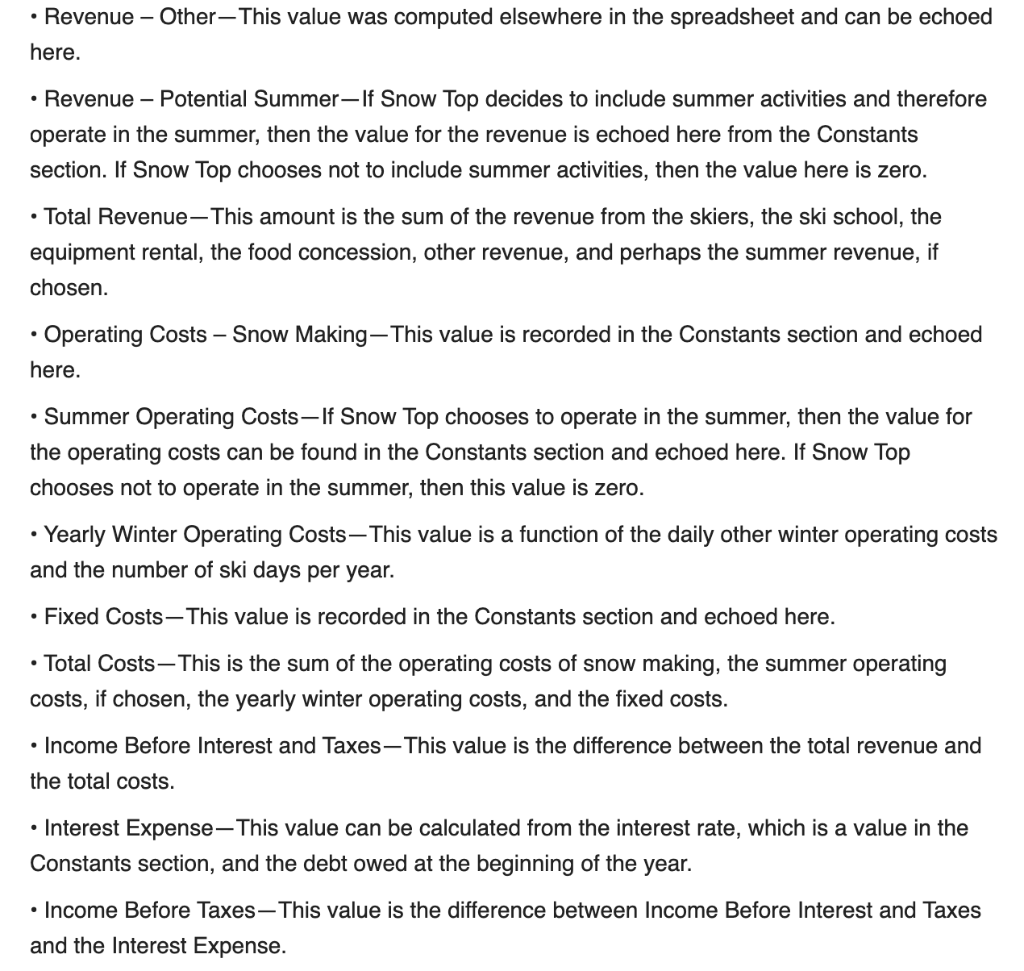
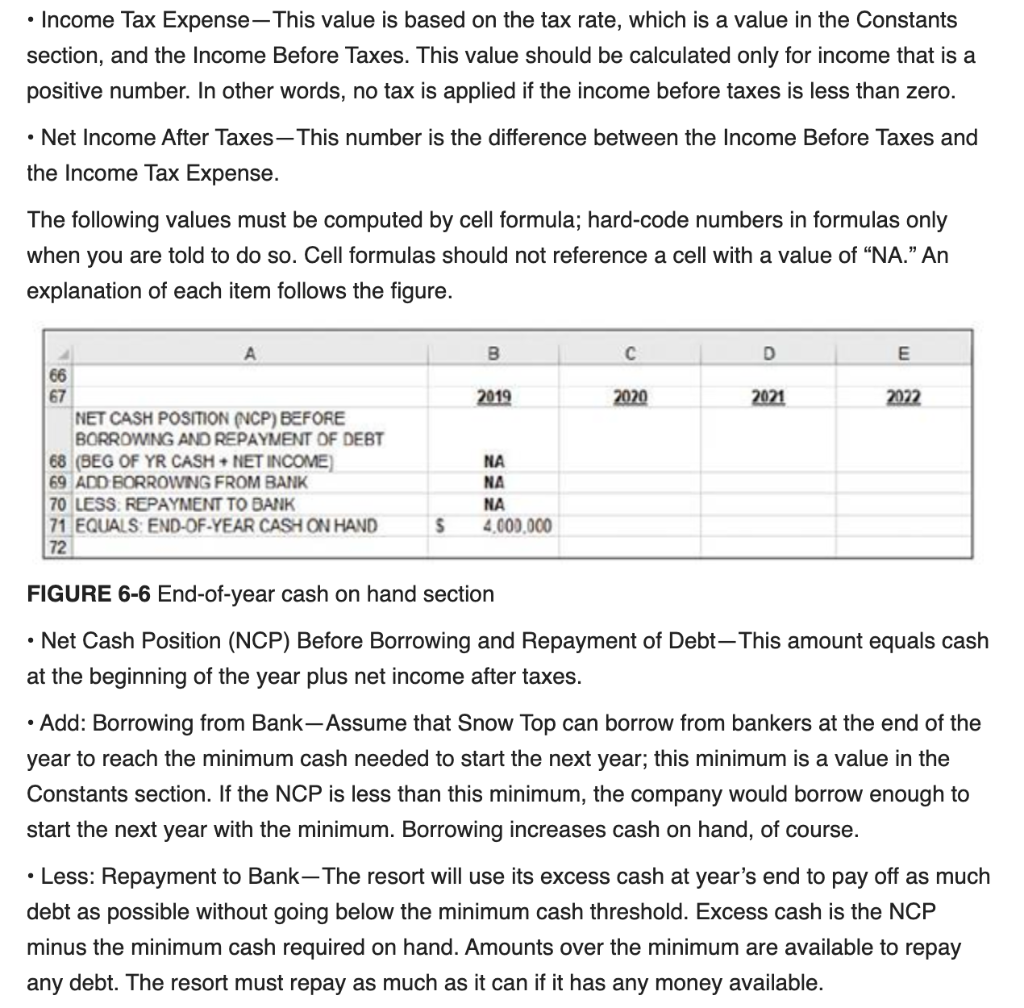
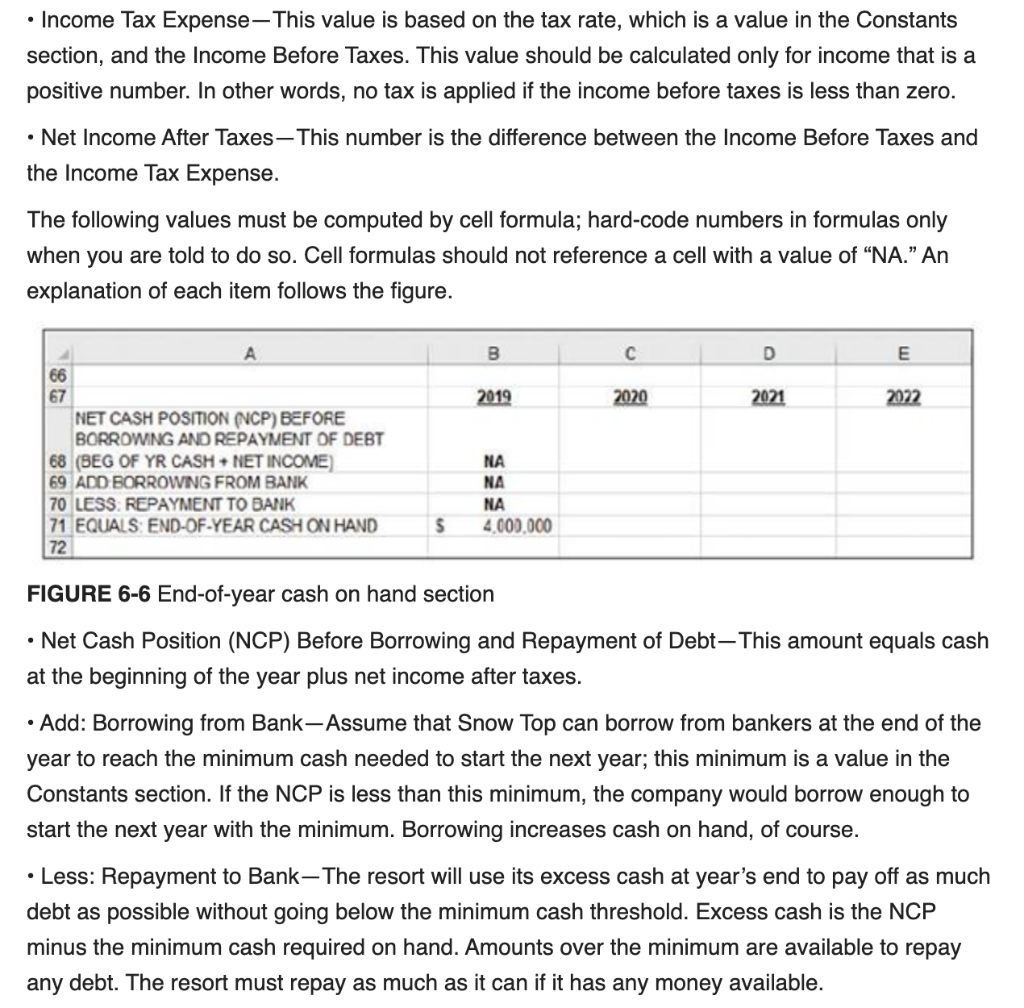
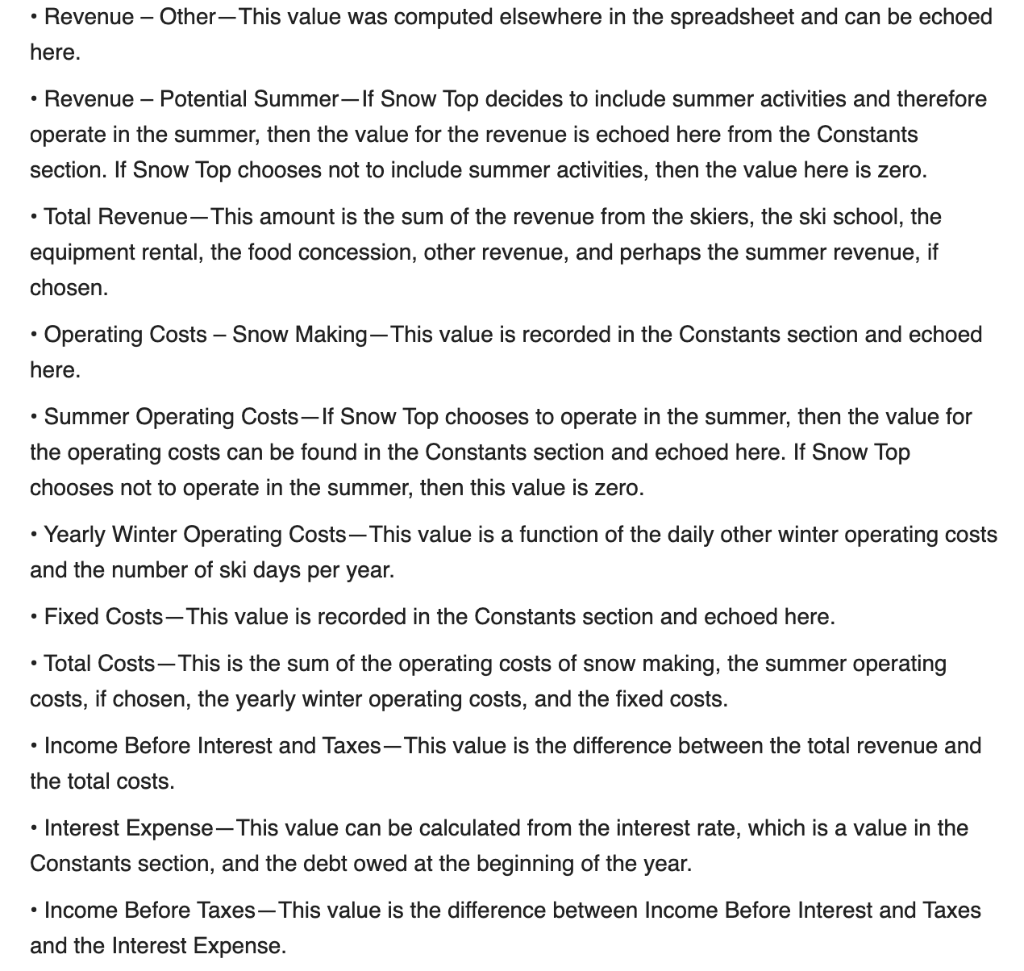
CREATING A SPREADSHEET FOR DECISION SUPPORT In this assignment, you will produce a spreadsheet that models Snow Top's financial situation. Then, in Assignment 2, you will run Scenario Manager twice to explore various financial scenarios and write a memorandum that documents your analysis and findings. First, you will create the spreadsheet model of the decision. The model covers the three years from 2020 to 2022. This section helps you set up each of the following spreadsheet components before entering cell formulas: . Constants Inputs . Summary of Key Results Calculations Income and Cash Flow statements Debt Owed A discussion of each section follows. The spreadsheet skeleton for this case is available for you to use; it will save you time. To access the spreadsheet skeleton, go to your data files, select Case 6, and then select Ski Resort.xlsx. Constants Section Your spreadsheet should include the constants shown in Figure 6-1. An explanation of the line items follows the figure. B D E 2020 0.20 4,000,000 $ $ 0.03 1 SKI RESORT INVESTMENT DECISION 2 3 CONSTANTS 4 TAX RATE 5 CASH NEEDED TO START NEXT YEAR 6 INTEREST RATE ON DEBT 7 DALY LIFT TICKET PRICE 8 ANNUAL LIFT TICKET PRICE 9 AVERAGE DAILY MONEY SPENT ON FOOD 10 AVERAGE SKI SCHOOL DAILY PRICE 11 AVERAGE DAILY RENTAL PRICE 12 NUMBER OF SKI DAYS PER YEAR 13 OTHER DALY REVENUE 14 SUMMER POTENTIAL REVENUE 15 OPERATING COSTS - SNOW MAKING 16 OPERATING COSTS - SUMMER 17 DALY OTHER WINTER OPERATING COSTS 18 FIXED COSTS 19 2019 NA NA NA NA NA NA NA NA $ $ $ $ $ 2021 0.20 4.000.000 $ 003 100 $ 700 S 25 s 45$ 27 $ 100 15 s 1 000.000 S 1 800,000 $ 350.000 $ 15.000 $ 35 000.000 $ 100 $ 700 5 25 S 455 25 S 100 15 $ $ 2,000,000 $ 350,000 $ 15.000 $ 35,000,000 $ 2022 0.20 4,000,000 0.03 100 700 25 45 30 100 15 1,000,000 1,800,000 400.000 15.000 35,000,000 NA $ $ $ $ $ $ FIGURE 6-1 Constants section Tax Rate-The rate at which Snow Top's net income is taxed is shown for each year. Cash Needed to Start Next Year-The local Vermont bank wants Snow Top to have at least $4 million cash at the beginning of each year. Assume that the ski resort could borrow from the bank at the end of a year in order to begin the new year with the needed amount. Interest Rate on Debt- This is the interest rate that the bank charges Snow Top on any outstanding debt. The interest is calculated for the year based on the debt owed at the beginning of the year. Daily Lift Ticket Price - This is the amount that Snow Top charges a customer to ski for an entire day at the resort. Annual Lift Ticket Price - This is the yearly amount (a one-time fee) that a skier will pay for an annual pass to the ski area. Skiers can then ski as many times as they choose. Average Daily Money Spent on Food, This is the average amount of money that skiers will spend on food and drink in the concession stands and restaurants at Snow Top. . Average Daily Money Spent on Food - This is the average amount of money that skiers will spend on food and drink in the concession stands and restaurants at Snow Top. Average Ski School Daily Price-If skiers choose to take a lesson, this is the average price they will pay for the lesson. Average Daily Rental Price-If skiers rent equipment, such as boots, poles, skis, and helmets, this is the average price they will pay for one day's rental. Number of Ski Days per Year - This is the average number of days in Vermont's ski season. Snow Top is open for business for this number of days per year. Other Daily Revenue-Skiers often forget or lose gloves, goggles, hats, or other equipment required to make skiing pleasurable. The resort has a shop that supplies these items along with souvenirs. This amount of other revenue is what Snow Top expects each day. Summer Potential Revenue If Snow Top decides to open for the summer and develop activities to attract visitors, it can expect this amount of revenue from the activities. Operating Costs Snow Making-Snow making is required most of the season due to the recent lack of natural snow. Snow making is a huge expense for the ski industry. Luckily, snow- making equipment continues to become more efficient, so the costs are not expected to increase. Operating costs - Summer-These are the expected costs that Snow Top will incur if it operates over the summer. Daily Other Winter Operating Costs - This is the additional daily cost of operating Snow Top, beyond the costs already noted. Fixed Costs - This is the amount of fixed costs per year; this number is not a function of how many days Snow Top is open each year Inputs Section Your spreadsheet should include the following inputs for the years 2020 to 2022, as shown in Figure 6-2. B . D ALL YRS A 19 20 INPUTS 21 RATE OF CHANGE IN SKERS 22 ECONOMIC OUTLOOK (Good, Poor) 23 CLIMATE CHANGE FACTOR 24 SUMMER OPERATIONS (Y OR N) 25 2020 NA NA 2021 NA NA 2022 NA NA NA NA FIGURE 6-2 Inputs section Rate of Change in SkiersThis percentage could be positive or negative, depending on how the resort thinks the number of future skiers will change. Economic Outlook-If the economy is going well and is expected to continue to hum along, enter Good in the cell. If the economy is faltering and is expected to be lackluster, enter Poor. Climate Change Factor- This percentage factor, expressed as a negative number, indicates the severity of climate change and its effect on the number of skiers. Summer Operations- If Snow Top decides to operate in the summer, enter Y in this cell. If not, the input is N. Summary of Key Results Section Your spreadsheet should include the results shown in Figure 6-3. B D E 25 26 SUMMARY OF KEY RESULTS 27 NET INCOME AFTER TAXES 28 END-OF-THE-YEAR CASH ON HAND 29 END-OF-THE-YEAR DEBT OWED 30 PROFIT MARGIN 31 FIGURE 6-3 Summary of Key Results section For each year, your spreadsheet should compute net income after taxes, cash on hand at the end of the year, debt owed at the end of the year, and profit margin. These values are computed elsewhere in the spreadsheet and should be echoed here for all years. Calculations Section You should calculate intermediate results that will be used in the income and cash flow statement that follows. The Calculations section is shown in Figure 6-4. When called for, use absolute referencing properly. Values must be computed by cell formula. Cell formulas should not reference a cell with a value of NA, which stands for not applicable. An explanation of each item in this section follows the figure. B D E 2019 2020 2021 2022 3000 500 31 32 CALCULATIONS 33 PERCENTAGE CHANGE NDALY SKIERS 34 NUMBER OF DAILY SKIERS 35 NUMBER OF SEASON SKIERS 36 YEARLY TOTAL SKER REVENUE 37 DAILY SKI SCHOOL ATTENDEES 38 YEARLY SKI SCHOOL REVENUE 39 DAILY EQUIPMENT RENTAL USERS 40 YEARLY RENTAL REVENUE 41 YEARLY FOOD CONCESSION REVENUE 42 OTHER YEARLY REVENUE 43 FIGURE 6-4 Calculations section Percentage Change in Daily Skiers - This number is a function of the rate of change in skiers, the economic outlook, and the climate change factor. If the economic outlook is poor, then the rate of change in skiers will decrease by 2 percent. The climate change factor will also be applied to the rate of change in skiers. For example, if the economic outlook is poor and the climate change factor is minus 3 percent, then the total rate of change in skiers will be the rate of change minus 2 percent minus 3 percent. Number of Daily SkiersThis number is a function of the percentage change in daily skiers and the previous year's number of daily skiers. Number of Season Skiers - This number is a function of the rate of change in skiers. The rate of change in skiers is applied to the prior year. Yearly Total Skier Revenue - This number is a function of the number of daily skiers, the average lift ticket price, and the number of ski days per year, plus a function of the number of annualpass skiers and the annual lift ticket price. Daily Ski School AttendeesThis number is a function of the number of daily skiers. Assume that 10 percent of the daily skiers will take ski school lessons. Yearly Ski School Revenue-This number is a function of the daily ski school attendees, the average ski school daily price, and the number of ski days per year. Daily Equipment Rental Users - This number is 75 percent of the daily number of skiers. Yearly Rental Revenue-This number is a function of the daily equipment rental users, the average daily rental price, and the number of ski days per year. Yearly Food Concession Revenue - This number is a function of the total number of skiers per year and the average daily money spent on food. Assume that 90 percent of skiers buy food. Other Yearly Revenue-This number is a function of the other daily revenue and the number of ski days per year. Income and Cash Flow Statements The forecast for net income and cash flow starts with the cash on hand at the beginning of the year. This value is followed by the income statement and the calculation of cash on hand at year's end. For readability, format cells in this section as currency with zero decimals. Values must be computed by cell formula; hard-code numbers in formulas only if you are told to do so. Cell formulas should not reference a cell with a value of NA. Your spreadsheets should look like those in Figures 6-5 and 6-6. A discussion of each item in the section follows each figure. Revenue - Other - This value was computed elsewhere in the spreadsheet and can be echoed here. Revenue - Potential Summer- If Snow Top decides to include summer activities and therefore operate in the summer, then the value for the revenue is echoed here from the Constants section. If Snow Top chooses not to include summer activities, then the value here is zero. Total Revenue - This amount is the sum of the revenue from the skiers, the ski school, the equipment rental, the food concession, other revenue, and perhaps the summer revenue, if chosen. Operating costs Snow Making-This value is recorded in the Constants section and echoed here. Summer Operating Costs - If Snow Top chooses to operate in the summer, then the value for the operating costs can be found in the Constants section and echoed here. If Snow Top chooses not to operate in the summer, then this value is zero. . Yearly Winter Operating Costs - This value is a function of the daily other winter operating costs and the number of ski days per year. Fixed Costs-This value is recorded in the Constants section and echoed here. Total CostsThis is the sum of the operating costs of snow making, the summer operating costs, if chosen, the yearly winter operating costs, and the fixed costs. Income Before Interest and Taxes-This value is the difference between the total revenue and the total costs. Interest ExpenseThis value can be calculated from the interest rate, which is a value in the Constants section, and the debt owed at the beginning of the year. Income Before Taxes-This value is the difference between Income Before Interest and Taxes and the Interest Expense. Income Tax Expense - This value is based on the tax rate, which is a value in the Constants section, and the Income Before Taxes. This value should be calculated only for income that is a positive number. In other words, no tax is applied if the income before taxes is less than zero. Net Income After Taxes-This number is the difference between the Income Before Taxes and the Income Tax Expense. The following values must be computed by cell formula; hard-code numbers in formulas only when you are told to do so. Cell formulas should not reference a cell with a value of "NA. An explanation of each item follows the figure. B D E 2019 2020 2021 2072 66 67 NET CASH POSITION (NCP) BEFORE BORROWING AND REPAYMENT OF DEBT 68 (BEG OF YR CASH NET INCOME 69 ADD BORROWING FROM BANK 70 LESS, REPAYMENT TO BANK 71 EQUALS END-OF-YEAR CASH ON HAND 72 NA NA NA 4,000,000 s FIGURE 6-6 End-of-year cash on hand section Net Cash Position (NCP) Before Borrowing and Repayment of Debt-This amount equals cash at the beginning of the year plus net income after taxes. Add: Borrowing from Bank-Assume that Snow Top can borrow from bankers at the end of the year to reach the minimum cash needed to start the next year; this minimum is a value in the Constants section. If the NCP is less than this minimum, the company would borrow enough to start the next year with the minimum. Borrowing increases cash on hand, of course. Less: Repayment to Bank-The resort will use its excess cash at year's end to pay off as much debt as possible without going below the minimum cash threshold. Excess cash is the NCP minus the minimum cash required on hand. Amounts over the minimum are available to repay any debt. The resort must repay as much as it can if it has any money available. Income Tax Expense - This value is based on the tax rate, which is a value in the Constants section, and the Income Before Taxes. This value should be calculated only for income that is a positive number. In other words, no tax is applied if the income before taxes is less than zero. Net Income After Taxes-This number is the difference between the Income Before Taxes and the Income Tax Expense. The following values must be computed by cell formula; hard-code numbers in formulas only when you are told to do so. Cell formulas should not reference a cell with a value of "NA. An explanation of each item follows the figure. B D E 2019 2020 2021 2072 66 67 NET CASH POSITION (NCP) BEFORE BORROWING AND REPAYMENT OF DEBT 68 (BEG OF YR CASH NET INCOME 69 ADD BORROWING FROM BANK 70 LESS, REPAYMENT TO BANK 71 EQUALS END-OF-YEAR CASH ON HAND 72 NA NA NA 4,000,000 s FIGURE 6-6 End-of-year cash on hand section Net Cash Position (NCP) Before Borrowing and Repayment of Debt-This amount equals cash at the beginning of the year plus net income after taxes. Add: Borrowing from Bank-Assume that Snow Top can borrow from bankers at the end of the year to reach the minimum cash needed to start the next year; this minimum is a value in the Constants section. If the NCP is less than this minimum, the company would borrow enough to start the next year with the minimum. Borrowing increases cash on hand, of course. Less: Repayment to Bank-The resort will use its excess cash at year's end to pay off as much debt as possible without going below the minimum cash threshold. Excess cash is the NCP minus the minimum cash required on hand. Amounts over the minimum are available to repay any debt. The resort must repay as much as it can if it has any money available. Revenue - Other - This value was computed elsewhere in the spreadsheet and can be echoed here. Revenue - Potential Summer- If Snow Top decides to include summer activities and therefore operate in the summer, then the value for the revenue is echoed here from the Constants section. If Snow Top chooses not to include summer activities, then the value here is zero. Total Revenue - This amount is the sum of the revenue from the skiers, the ski school, the equipment rental, the food concession, other revenue, and perhaps the summer revenue, if chosen. Operating costs Snow Making-This value is recorded in the Constants section and echoed here. Summer Operating Costs - If Snow Top chooses to operate in the summer, then the value for the operating costs can be found in the Constants section and echoed here. If Snow Top chooses not to operate in the summer, then this value is zero. . Yearly Winter Operating Costs - This value is a function of the daily other winter operating costs and the number of ski days per year. Fixed Costs-This value is recorded in the Constants section and echoed here. Total CostsThis is the sum of the operating costs of snow making, the summer operating costs, if chosen, the yearly winter operating costs, and the fixed costs. Income Before Interest and Taxes-This value is the difference between the total revenue and the total costs. Interest ExpenseThis value can be calculated from the interest rate, which is a value in the Constants section, and the debt owed at the beginning of the year. Income Before Taxes-This value is the difference between Income Before Interest and Taxes and the Interest Expense. CREATING A SPREADSHEET FOR DECISION SUPPORT In this assignment, you will produce a spreadsheet that models Snow Top's financial situation. Then, in Assignment 2, you will run Scenario Manager twice to explore various financial scenarios and write a memorandum that documents your analysis and findings. First, you will create the spreadsheet model of the decision. The model covers the three years from 2020 to 2022. This section helps you set up each of the following spreadsheet components before entering cell formulas: . Constants Inputs . Summary of Key Results Calculations Income and Cash Flow statements Debt Owed A discussion of each section follows. The spreadsheet skeleton for this case is available for you to use; it will save you time. To access the spreadsheet skeleton, go to your data files, select Case 6, and then select Ski Resort.xlsx. Constants Section Your spreadsheet should include the constants shown in Figure 6-1. An explanation of the line items follows the figure. B D E 2020 0.20 4,000,000 $ $ 0.03 1 SKI RESORT INVESTMENT DECISION 2 3 CONSTANTS 4 TAX RATE 5 CASH NEEDED TO START NEXT YEAR 6 INTEREST RATE ON DEBT 7 DALY LIFT TICKET PRICE 8 ANNUAL LIFT TICKET PRICE 9 AVERAGE DAILY MONEY SPENT ON FOOD 10 AVERAGE SKI SCHOOL DAILY PRICE 11 AVERAGE DAILY RENTAL PRICE 12 NUMBER OF SKI DAYS PER YEAR 13 OTHER DALY REVENUE 14 SUMMER POTENTIAL REVENUE 15 OPERATING COSTS - SNOW MAKING 16 OPERATING COSTS - SUMMER 17 DALY OTHER WINTER OPERATING COSTS 18 FIXED COSTS 19 2019 NA NA NA NA NA NA NA NA $ $ $ $ $ 2021 0.20 4.000.000 $ 003 100 $ 700 S 25 s 45$ 27 $ 100 15 s 1 000.000 S 1 800,000 $ 350.000 $ 15.000 $ 35 000.000 $ 100 $ 700 5 25 S 455 25 S 100 15 $ $ 2,000,000 $ 350,000 $ 15.000 $ 35,000,000 $ 2022 0.20 4,000,000 0.03 100 700 25 45 30 100 15 1,000,000 1,800,000 400.000 15.000 35,000,000 NA $ $ $ $ $ $ FIGURE 6-1 Constants section Tax Rate-The rate at which Snow Top's net income is taxed is shown for each year. Cash Needed to Start Next Year-The local Vermont bank wants Snow Top to have at least $4 million cash at the beginning of each year. Assume that the ski resort could borrow from the bank at the end of a year in order to begin the new year with the needed amount. Interest Rate on Debt- This is the interest rate that the bank charges Snow Top on any outstanding debt. The interest is calculated for the year based on the debt owed at the beginning of the year. Daily Lift Ticket Price - This is the amount that Snow Top charges a customer to ski for an entire day at the resort. Annual Lift Ticket Price - This is the yearly amount (a one-time fee) that a skier will pay for an annual pass to the ski area. Skiers can then ski as many times as they choose. Average Daily Money Spent on Food, This is the average amount of money that skiers will spend on food and drink in the concession stands and restaurants at Snow Top. . Average Daily Money Spent on Food - This is the average amount of money that skiers will spend on food and drink in the concession stands and restaurants at Snow Top. Average Ski School Daily Price-If skiers choose to take a lesson, this is the average price they will pay for the lesson. Average Daily Rental Price-If skiers rent equipment, such as boots, poles, skis, and helmets, this is the average price they will pay for one day's rental. Number of Ski Days per Year - This is the average number of days in Vermont's ski season. Snow Top is open for business for this number of days per year. Other Daily Revenue-Skiers often forget or lose gloves, goggles, hats, or other equipment required to make skiing pleasurable. The resort has a shop that supplies these items along with souvenirs. This amount of other revenue is what Snow Top expects each day. Summer Potential Revenue If Snow Top decides to open for the summer and develop activities to attract visitors, it can expect this amount of revenue from the activities. Operating Costs Snow Making-Snow making is required most of the season due to the recent lack of natural snow. Snow making is a huge expense for the ski industry. Luckily, snow- making equipment continues to become more efficient, so the costs are not expected to increase. Operating costs - Summer-These are the expected costs that Snow Top will incur if it operates over the summer. Daily Other Winter Operating Costs - This is the additional daily cost of operating Snow Top, beyond the costs already noted. Fixed Costs - This is the amount of fixed costs per year; this number is not a function of how many days Snow Top is open each year Inputs Section Your spreadsheet should include the following inputs for the years 2020 to 2022, as shown in Figure 6-2. B . D ALL YRS A 19 20 INPUTS 21 RATE OF CHANGE IN SKERS 22 ECONOMIC OUTLOOK (Good, Poor) 23 CLIMATE CHANGE FACTOR 24 SUMMER OPERATIONS (Y OR N) 25 2020 NA NA 2021 NA NA 2022 NA NA NA NA FIGURE 6-2 Inputs section Rate of Change in SkiersThis percentage could be positive or negative, depending on how the resort thinks the number of future skiers will change. Economic Outlook-If the economy is going well and is expected to continue to hum along, enter Good in the cell. If the economy is faltering and is expected to be lackluster, enter Poor. Climate Change Factor- This percentage factor, expressed as a negative number, indicates the severity of climate change and its effect on the number of skiers. Summer Operations- If Snow Top decides to operate in the summer, enter Y in this cell. If not, the input is N. Summary of Key Results Section Your spreadsheet should include the results shown in Figure 6-3. B D E 25 26 SUMMARY OF KEY RESULTS 27 NET INCOME AFTER TAXES 28 END-OF-THE-YEAR CASH ON HAND 29 END-OF-THE-YEAR DEBT OWED 30 PROFIT MARGIN 31 FIGURE 6-3 Summary of Key Results section For each year, your spreadsheet should compute net income after taxes, cash on hand at the end of the year, debt owed at the end of the year, and profit margin. These values are computed elsewhere in the spreadsheet and should be echoed here for all years. Calculations Section You should calculate intermediate results that will be used in the income and cash flow statement that follows. The Calculations section is shown in Figure 6-4. When called for, use absolute referencing properly. Values must be computed by cell formula. Cell formulas should not reference a cell with a value of NA, which stands for not applicable. An explanation of each item in this section follows the figure. B D E 2019 2020 2021 2022 3000 500 31 32 CALCULATIONS 33 PERCENTAGE CHANGE NDALY SKIERS 34 NUMBER OF DAILY SKIERS 35 NUMBER OF SEASON SKIERS 36 YEARLY TOTAL SKER REVENUE 37 DAILY SKI SCHOOL ATTENDEES 38 YEARLY SKI SCHOOL REVENUE 39 DAILY EQUIPMENT RENTAL USERS 40 YEARLY RENTAL REVENUE 41 YEARLY FOOD CONCESSION REVENUE 42 OTHER YEARLY REVENUE 43 FIGURE 6-4 Calculations section Percentage Change in Daily Skiers - This number is a function of the rate of change in skiers, the economic outlook, and the climate change factor. If the economic outlook is poor, then the rate of change in skiers will decrease by 2 percent. The climate change factor will also be applied to the rate of change in skiers. For example, if the economic outlook is poor and the climate change factor is minus 3 percent, then the total rate of change in skiers will be the rate of change minus 2 percent minus 3 percent. Number of Daily SkiersThis number is a function of the percentage change in daily skiers and the previous year's number of daily skiers. Number of Season Skiers - This number is a function of the rate of change in skiers. The rate of change in skiers is applied to the prior year. Yearly Total Skier Revenue - This number is a function of the number of daily skiers, the average lift ticket price, and the number of ski days per year, plus a function of the number of annualpass skiers and the annual lift ticket price. Daily Ski School AttendeesThis number is a function of the number of daily skiers. Assume that 10 percent of the daily skiers will take ski school lessons. Yearly Ski School Revenue-This number is a function of the daily ski school attendees, the average ski school daily price, and the number of ski days per year. Daily Equipment Rental Users - This number is 75 percent of the daily number of skiers. Yearly Rental Revenue-This number is a function of the daily equipment rental users, the average daily rental price, and the number of ski days per year. Yearly Food Concession Revenue - This number is a function of the total number of skiers per year and the average daily money spent on food. Assume that 90 percent of skiers buy food. Other Yearly Revenue-This number is a function of the other daily revenue and the number of ski days per year. Income and Cash Flow Statements The forecast for net income and cash flow starts with the cash on hand at the beginning of the year. This value is followed by the income statement and the calculation of cash on hand at year's end. For readability, format cells in this section as currency with zero decimals. Values must be computed by cell formula; hard-code numbers in formulas only if you are told to do so. Cell formulas should not reference a cell with a value of NA. Your spreadsheets should look like those in Figures 6-5 and 6-6. A discussion of each item in the section follows each figure. Revenue - Other - This value was computed elsewhere in the spreadsheet and can be echoed here. Revenue - Potential Summer- If Snow Top decides to include summer activities and therefore operate in the summer, then the value for the revenue is echoed here from the Constants section. If Snow Top chooses not to include summer activities, then the value here is zero. Total Revenue - This amount is the sum of the revenue from the skiers, the ski school, the equipment rental, the food concession, other revenue, and perhaps the summer revenue, if chosen. Operating costs Snow Making-This value is recorded in the Constants section and echoed here. Summer Operating Costs - If Snow Top chooses to operate in the summer, then the value for the operating costs can be found in the Constants section and echoed here. If Snow Top chooses not to operate in the summer, then this value is zero. . Yearly Winter Operating Costs - This value is a function of the daily other winter operating costs and the number of ski days per year. Fixed Costs-This value is recorded in the Constants section and echoed here. Total CostsThis is the sum of the operating costs of snow making, the summer operating costs, if chosen, the yearly winter operating costs, and the fixed costs. Income Before Interest and Taxes-This value is the difference between the total revenue and the total costs. Interest ExpenseThis value can be calculated from the interest rate, which is a value in the Constants section, and the debt owed at the beginning of the year. Income Before Taxes-This value is the difference between Income Before Interest and Taxes and the Interest Expense. Income Tax Expense - This value is based on the tax rate, which is a value in the Constants section, and the Income Before Taxes. This value should be calculated only for income that is a positive number. In other words, no tax is applied if the income before taxes is less than zero. Net Income After Taxes-This number is the difference between the Income Before Taxes and the Income Tax Expense. The following values must be computed by cell formula; hard-code numbers in formulas only when you are told to do so. Cell formulas should not reference a cell with a value of "NA. An explanation of each item follows the figure. B D E 2019 2020 2021 2072 66 67 NET CASH POSITION (NCP) BEFORE BORROWING AND REPAYMENT OF DEBT 68 (BEG OF YR CASH NET INCOME 69 ADD BORROWING FROM BANK 70 LESS, REPAYMENT TO BANK 71 EQUALS END-OF-YEAR CASH ON HAND 72 NA NA NA 4,000,000 s FIGURE 6-6 End-of-year cash on hand section Net Cash Position (NCP) Before Borrowing and Repayment of Debt-This amount equals cash at the beginning of the year plus net income after taxes. Add: Borrowing from Bank-Assume that Snow Top can borrow from bankers at the end of the year to reach the minimum cash needed to start the next year; this minimum is a value in the Constants section. If the NCP is less than this minimum, the company would borrow enough to start the next year with the minimum. Borrowing increases cash on hand, of course. Less: Repayment to Bank-The resort will use its excess cash at year's end to pay off as much debt as possible without going below the minimum cash threshold. Excess cash is the NCP minus the minimum cash required on hand. Amounts over the minimum are available to repay any debt. The resort must repay as much as it can if it has any money available. Income Tax Expense - This value is based on the tax rate, which is a value in the Constants section, and the Income Before Taxes. This value should be calculated only for income that is a positive number. In other words, no tax is applied if the income before taxes is less than zero. Net Income After Taxes-This number is the difference between the Income Before Taxes and the Income Tax Expense. The following values must be computed by cell formula; hard-code numbers in formulas only when you are told to do so. Cell formulas should not reference a cell with a value of "NA. An explanation of each item follows the figure. B D E 2019 2020 2021 2072 66 67 NET CASH POSITION (NCP) BEFORE BORROWING AND REPAYMENT OF DEBT 68 (BEG OF YR CASH NET INCOME 69 ADD BORROWING FROM BANK 70 LESS, REPAYMENT TO BANK 71 EQUALS END-OF-YEAR CASH ON HAND 72 NA NA NA 4,000,000 s FIGURE 6-6 End-of-year cash on hand section Net Cash Position (NCP) Before Borrowing and Repayment of Debt-This amount equals cash at the beginning of the year plus net income after taxes. Add: Borrowing from Bank-Assume that Snow Top can borrow from bankers at the end of the year to reach the minimum cash needed to start the next year; this minimum is a value in the Constants section. If the NCP is less than this minimum, the company would borrow enough to start the next year with the minimum. Borrowing increases cash on hand, of course. Less: Repayment to Bank-The resort will use its excess cash at year's end to pay off as much debt as possible without going below the minimum cash threshold. Excess cash is the NCP minus the minimum cash required on hand. Amounts over the minimum are available to repay any debt. The resort must repay as much as it can if it has any money available. Revenue - Other - This value was computed elsewhere in the spreadsheet and can be echoed here. Revenue - Potential Summer- If Snow Top decides to include summer activities and therefore operate in the summer, then the value for the revenue is echoed here from the Constants section. If Snow Top chooses not to include summer activities, then the value here is zero. Total Revenue - This amount is the sum of the revenue from the skiers, the ski school, the equipment rental, the food concession, other revenue, and perhaps the summer revenue, if chosen. Operating costs Snow Making-This value is recorded in the Constants section and echoed here. Summer Operating Costs - If Snow Top chooses to operate in the summer, then the value for the operating costs can be found in the Constants section and echoed here. If Snow Top chooses not to operate in the summer, then this value is zero. . Yearly Winter Operating Costs - This value is a function of the daily other winter operating costs and the number of ski days per year. Fixed Costs-This value is recorded in the Constants section and echoed here. Total CostsThis is the sum of the operating costs of snow making, the summer operating costs, if chosen, the yearly winter operating costs, and the fixed costs. Income Before Interest and Taxes-This value is the difference between the total revenue and the total costs. Interest ExpenseThis value can be calculated from the interest rate, which is a value in the Constants section, and the debt owed at the beginning of the year. Income Before Taxes-This value is the difference between Income Before Interest and Taxes and the Interest Expense


