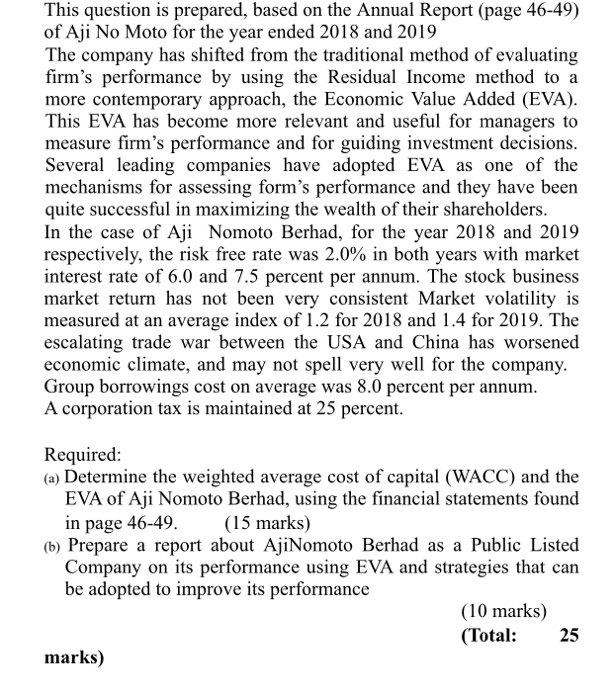
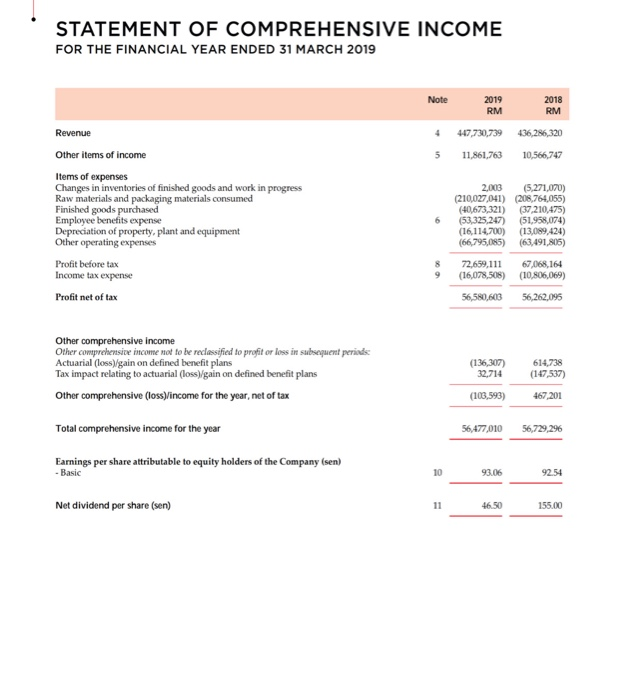
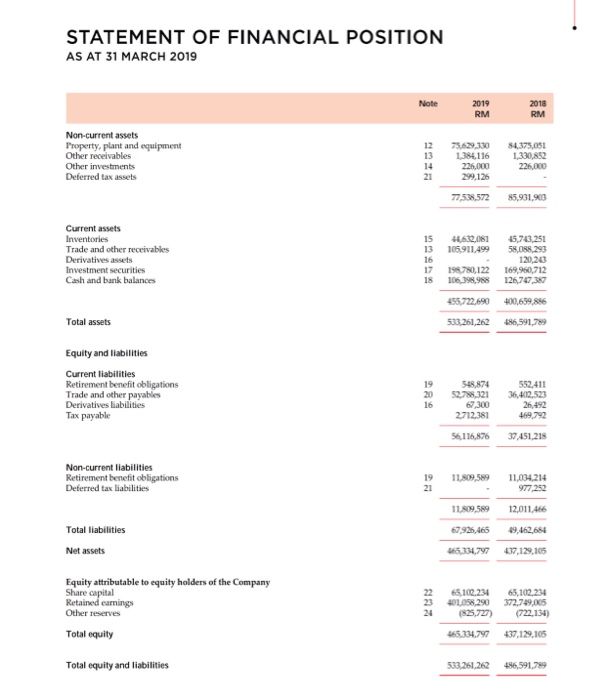
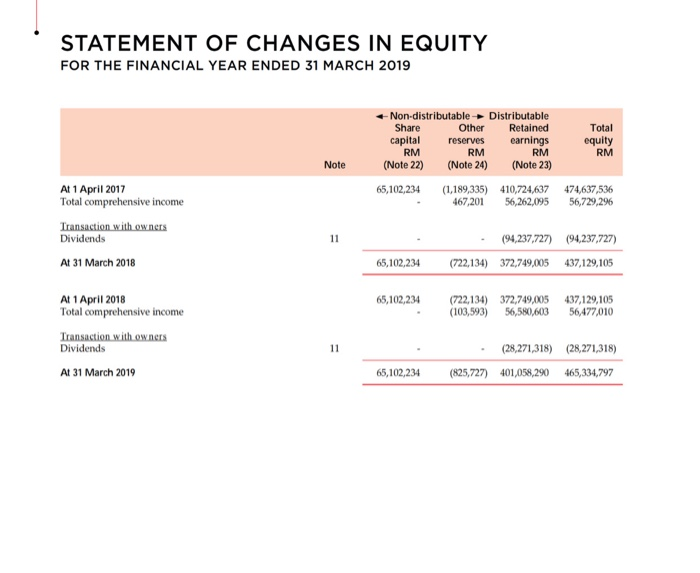
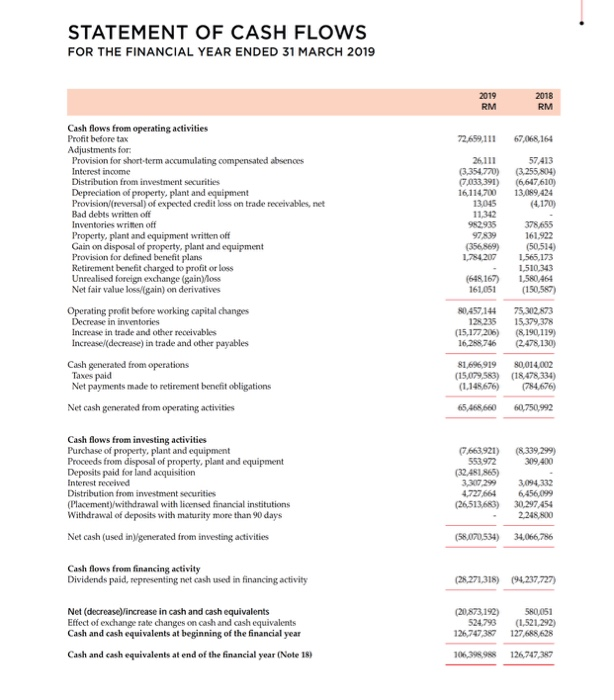
This question is prepared, based on the Annual Report (page 46-49) of Aji No Moto for the year ended 2018 and 2019 The company has shifted from the traditional method of evaluating firm's performance by using the Residual Income method to a more contemporary approach, the Economic Value Added (EVA). This EVA has become more relevant and useful for managers to measure firm's performance and for guiding investment decisions. Several leading companies have adopted EVA as one of the mechanisms for assessing form's performance and they have been quite successful in maximizing the wealth of their shareholders. In the case of Aji Nomoto Berhad, for the year 2018 and 2019 respectively, the risk free rate was 2.0% in both years with market interest rate of 6.0 and 7.5 percent per annum. The stock business market return has not been very consistent Market volatility is measured at an average index of 1.2 for 2018 and 1.4 for 2019. The escalating trade war between the USA and China has worsened economic climate, and may not spell very well for the company. Group borrowings cost on average was 8.0 percent per annum. A corporation tax is maintained at 25 percent. Required: (a) Determine the weighted average cost of capital (WACC) and the EVA of Aji Nomoto Berhad, using the financial statements found in page 46-49. (15 marks) (6) Prepare a report about AjiNomoto Berhad as a Public Listed Company on its performance using EVA and strategies that can be adopted to improve its performance (10 marks) (Total: 25 marks) STATEMENT OF COMPREHENSIVE INCOME FOR THE FINANCIAL YEAR ENDED 31 MARCH 2019 Note 2019 RM 2018 RM Revenue 4 447,730,739 436,286,320 5 11,861,763 10,566,747 Other items of income Items of expenses Changes in inventories of finished goods and work in progress Raw materials and packaging materials consumed Employee benefits expense Depreciation of property, plant and equipment Other operating expenses 6 2.003 (5,271,070) (210,027,041) (208,764,055) (40,673,321) (37,210,475) (53,325,247) (51,958,074) (16,114,700) (13,089,424) (66,795,085) (63,491,805) Profit before tax Income tax expense 8 9 72,659,111 (16,078,508) 67,068,164 (10,806,069) 56,262,095 Profit net of tax 56,580,603 Other comprehensive income Other comprehensive income not to be reclassified to profit or loss in subsequent periods Actuarial (loss/gain on defined benefit plans Tax impact relating to actuarial (loss)gain on defined benefit plans Other comprehensive (loss)income for the year, net of tax (136,307) 32,714 (103,593) 614,738 (147,537) 467,201 Total comprehensive income for the year 56,477,010 56,729,296 Earnings per share attributable to equity holders of the Company (sen) - Basic 10 93.06 92.54 Net dividend per share (sen) 11 46.50 155.00 STATEMENT OF FINANCIAL POSITION AS AT 31 MARCH 2019 Note 2019 RM 2018 RM Non-current assets Property, plant and equipment Other receivables Other investments Deferred tax assets 12 13 14 21 1,384.116 225.000 84.375.081 1,330,852 226,000 77,538,572 85,931,900 4632,061 105.911.499 Current assets Inventories Trade and other receivables Derivatives assets Investment securities Cash and bank balances 15 13 16 17 18 45,743,251 58.08.20 120,213 169,960,712 126,747,387 198780,122 106.398.988 455.722,690 400,659,886 Total assets 533.261,262 486,591,789 Equity and liabilities Current liabilities Retirement benefit obligations Trade and other payables Derivatives liabilities Tax payable 19 20 16 548,874 52,788,321 67,300 2712,381 552,411 36,402.523 26,492 469,792 56,116,876 37.451,215 Non-current liabilities Retirement benefit obligations Deferred tax liabilities 11.809,589 19 21 11,034,214 977,252 11.809,589 12,011,466 Total liabilities 67,926,465 19,462,684 Net assets 465,334,797 437,129,105 Equity attributable to equity holders of the Company Share capital Retained earnings Other reserves Total equity 66,102,234 401.05.290 (825,727) 65,102,234 372,749,005 (722,134) 465.334.797 437,129,105 Total equity and liabilities 533.261,262 456,591,789 STATEMENT OF CHANGES IN EQUITY FOR THE FINANCIAL YEAR ENDED 31 MARCH 2019 -Non-distributable Distributable Share Other Retained Total capital reserves earnings equity RM RM RM RM (Note 22) (Note 24) (Note 23) 65,102,234 (1,189,335) 410,724,637 474,637,536 467,201 56,262,095 56,729,296 Note At 1 April 2017 Total comprehensive income Transaction with owners Dividends At 31 March 2018 11 (94,237,727) (94,237,727) (722,134) 372,749,005 437,129,105 65,102,234 65,102,234 (722,134) 372,749,005 (103,593) 56,580,603 437,129,105 56,477,010 At 1 April 2018 Total comprehensive income Transaction with owners Dividends At 31 March 2019 11 (28,271,318) (28,271,318) (825,727) 401,058,290 465,334,797 65,102,234 STATEMENT OF CASH FLOWS FOR THE FINANCIAL YEAR ENDED 31 MARCH 2019 2019 RM 2018 RM 72,659,111 67,068,164 26.111 (3.354.770) 7,033,391) 16,114.700 13.045 11.342 982935 97809 (356,869) 1,784.207 57413 (3.255.804) (6,647,610) 13,089,424 (4.170) Cash flows from operating activities Profit before tax Adjustments for: Provision for short-term accumulating compensated absences Interest income Distribution from investment securities Depreciation of property, plant and equipment Provision (reversal of expected credit loss on trade receivables, net Bad debts written off Inventories written off Property, plant and equipment written off Gain on disposal of property, plant and equipment Provision for defined benefit plans Retirement benefit charged to profit or loss Unrealised foreign exchange (gain) loss Net fair value loss/(gain) on derivatives Operating profit before working capital changes Decrease in inventories Increase in trade and other receivables Increase (decrease) in trade and other payables Cash generated from operations Taxes paid Net payments made to retirement benefit obligations Net cash generated from operating activities (648167) 161.051 378.655 161,922 (50,514) 1,565,173 1,510,343 1,580,464 (150,587) 75,302,873 15,379,378 (8,190,119) (2.478.130) 80,457,144 128235 (15,177 206) 16,288,746 81,696,919 80,014,002 (15,079,583) (18,478,334) (1.145,676) (784.676) 65,468,660 60,750,992 (8,339,299) 309,400 Cash flows from investing activities Purchase of property, plant and equipment Proceeds from disposal of property, plant and equipment Deposits paid for land acquisition Interest received Distribution from investment securities (Placement)/withdrawal with licensed financial institutions Withdrawal of deposits with maturity more than 9 90 days Net cash (used in)generated from investing activities (7.663,921) 553.972 (32481.865) 3,310,299 4.727,664 (26.513.683) 3,094332 6,456,099 30.297 454 2,248,800 (58,070,534) 34,066,786 Cash flows from financing activity Dividends paid, representing net cash used in financing activity (28,271,318) (94.237,727) Net (decrease increase in cash and cash equivalents Effect of exchange rate changes on cash and cash equivalents Cash and cash equivalents at beginning of the financial year Cash and cash equivalents at end of the financial year (Note 18) (20.873,192) 524.793 126, 747,35 580,051 (1,521,292) 127,688,628 106.39.988 126,747,347 This question is prepared, based on the Annual Report (page 46-49) of Aji No Moto for the year ended 2018 and 2019 The company has shifted from the traditional method of evaluating firm's performance by using the Residual Income method to a more contemporary approach, the Economic Value Added (EVA). This EVA has become more relevant and useful for managers to measure firm's performance and for guiding investment decisions. Several leading companies have adopted EVA as one of the mechanisms for assessing form's performance and they have been quite successful in maximizing the wealth of their shareholders. In the case of Aji Nomoto Berhad, for the year 2018 and 2019 respectively, the risk free rate was 2.0% in both years with market interest rate of 6.0 and 7.5 percent per annum. The stock business market return has not been very consistent Market volatility is measured at an average index of 1.2 for 2018 and 1.4 for 2019. The escalating trade war between the USA and China has worsened economic climate, and may not spell very well for the company. Group borrowings cost on average was 8.0 percent per annum. A corporation tax is maintained at 25 percent. Required: (a) Determine the weighted average cost of capital (WACC) and the EVA of Aji Nomoto Berhad, using the financial statements found in page 46-49. (15 marks) (6) Prepare a report about AjiNomoto Berhad as a Public Listed Company on its performance using EVA and strategies that can be adopted to improve its performance (10 marks) (Total: 25 marks) STATEMENT OF COMPREHENSIVE INCOME FOR THE FINANCIAL YEAR ENDED 31 MARCH 2019 Note 2019 RM 2018 RM Revenue 4 447,730,739 436,286,320 5 11,861,763 10,566,747 Other items of income Items of expenses Changes in inventories of finished goods and work in progress Raw materials and packaging materials consumed Employee benefits expense Depreciation of property, plant and equipment Other operating expenses 6 2.003 (5,271,070) (210,027,041) (208,764,055) (40,673,321) (37,210,475) (53,325,247) (51,958,074) (16,114,700) (13,089,424) (66,795,085) (63,491,805) Profit before tax Income tax expense 8 9 72,659,111 (16,078,508) 67,068,164 (10,806,069) 56,262,095 Profit net of tax 56,580,603 Other comprehensive income Other comprehensive income not to be reclassified to profit or loss in subsequent periods Actuarial (loss/gain on defined benefit plans Tax impact relating to actuarial (loss)gain on defined benefit plans Other comprehensive (loss)income for the year, net of tax (136,307) 32,714 (103,593) 614,738 (147,537) 467,201 Total comprehensive income for the year 56,477,010 56,729,296 Earnings per share attributable to equity holders of the Company (sen) - Basic 10 93.06 92.54 Net dividend per share (sen) 11 46.50 155.00 STATEMENT OF FINANCIAL POSITION AS AT 31 MARCH 2019 Note 2019 RM 2018 RM Non-current assets Property, plant and equipment Other receivables Other investments Deferred tax assets 12 13 14 21 1,384.116 225.000 84.375.081 1,330,852 226,000 77,538,572 85,931,900 4632,061 105.911.499 Current assets Inventories Trade and other receivables Derivatives assets Investment securities Cash and bank balances 15 13 16 17 18 45,743,251 58.08.20 120,213 169,960,712 126,747,387 198780,122 106.398.988 455.722,690 400,659,886 Total assets 533.261,262 486,591,789 Equity and liabilities Current liabilities Retirement benefit obligations Trade and other payables Derivatives liabilities Tax payable 19 20 16 548,874 52,788,321 67,300 2712,381 552,411 36,402.523 26,492 469,792 56,116,876 37.451,215 Non-current liabilities Retirement benefit obligations Deferred tax liabilities 11.809,589 19 21 11,034,214 977,252 11.809,589 12,011,466 Total liabilities 67,926,465 19,462,684 Net assets 465,334,797 437,129,105 Equity attributable to equity holders of the Company Share capital Retained earnings Other reserves Total equity 66,102,234 401.05.290 (825,727) 65,102,234 372,749,005 (722,134) 465.334.797 437,129,105 Total equity and liabilities 533.261,262 456,591,789 STATEMENT OF CHANGES IN EQUITY FOR THE FINANCIAL YEAR ENDED 31 MARCH 2019 -Non-distributable Distributable Share Other Retained Total capital reserves earnings equity RM RM RM RM (Note 22) (Note 24) (Note 23) 65,102,234 (1,189,335) 410,724,637 474,637,536 467,201 56,262,095 56,729,296 Note At 1 April 2017 Total comprehensive income Transaction with owners Dividends At 31 March 2018 11 (94,237,727) (94,237,727) (722,134) 372,749,005 437,129,105 65,102,234 65,102,234 (722,134) 372,749,005 (103,593) 56,580,603 437,129,105 56,477,010 At 1 April 2018 Total comprehensive income Transaction with owners Dividends At 31 March 2019 11 (28,271,318) (28,271,318) (825,727) 401,058,290 465,334,797 65,102,234 STATEMENT OF CASH FLOWS FOR THE FINANCIAL YEAR ENDED 31 MARCH 2019 2019 RM 2018 RM 72,659,111 67,068,164 26.111 (3.354.770) 7,033,391) 16,114.700 13.045 11.342 982935 97809 (356,869) 1,784.207 57413 (3.255.804) (6,647,610) 13,089,424 (4.170) Cash flows from operating activities Profit before tax Adjustments for: Provision for short-term accumulating compensated absences Interest income Distribution from investment securities Depreciation of property, plant and equipment Provision (reversal of expected credit loss on trade receivables, net Bad debts written off Inventories written off Property, plant and equipment written off Gain on disposal of property, plant and equipment Provision for defined benefit plans Retirement benefit charged to profit or loss Unrealised foreign exchange (gain) loss Net fair value loss/(gain) on derivatives Operating profit before working capital changes Decrease in inventories Increase in trade and other receivables Increase (decrease) in trade and other payables Cash generated from operations Taxes paid Net payments made to retirement benefit obligations Net cash generated from operating activities (648167) 161.051 378.655 161,922 (50,514) 1,565,173 1,510,343 1,580,464 (150,587) 75,302,873 15,379,378 (8,190,119) (2.478.130) 80,457,144 128235 (15,177 206) 16,288,746 81,696,919 80,014,002 (15,079,583) (18,478,334) (1.145,676) (784.676) 65,468,660 60,750,992 (8,339,299) 309,400 Cash flows from investing activities Purchase of property, plant and equipment Proceeds from disposal of property, plant and equipment Deposits paid for land acquisition Interest received Distribution from investment securities (Placement)/withdrawal with licensed financial institutions Withdrawal of deposits with maturity more than 9 90 days Net cash (used in)generated from investing activities (7.663,921) 553.972 (32481.865) 3,310,299 4.727,664 (26.513.683) 3,094332 6,456,099 30.297 454 2,248,800 (58,070,534) 34,066,786 Cash flows from financing activity Dividends paid, representing net cash used in financing activity (28,271,318) (94.237,727) Net (decrease increase in cash and cash equivalents Effect of exchange rate changes on cash and cash equivalents Cash and cash equivalents at beginning of the financial year Cash and cash equivalents at end of the financial year (Note 18) (20.873,192) 524.793 126, 747,35 580,051 (1,521,292) 127,688,628 106.39.988 126,747,347