This question is related to financial management. Calculating the following ratios for the last three years (2019/2018/2017) and create the Dupont Analysis from the table given below
1.Liquidity ratio
2.Profitability ratio
3.Efficiency ratio
4.Leverage ration
5. Market Value
- Analyze and interpret your numbers (Whether If it is in good financial position or what)
I notice that People Would say the data is incomplete, Can you mention what is the data you require, please.
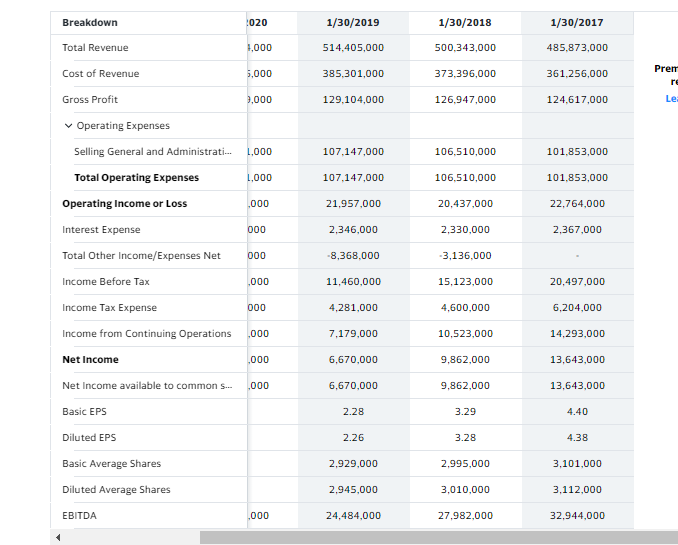
Here is the income sheet in Millions (Ignore the Year 2020):
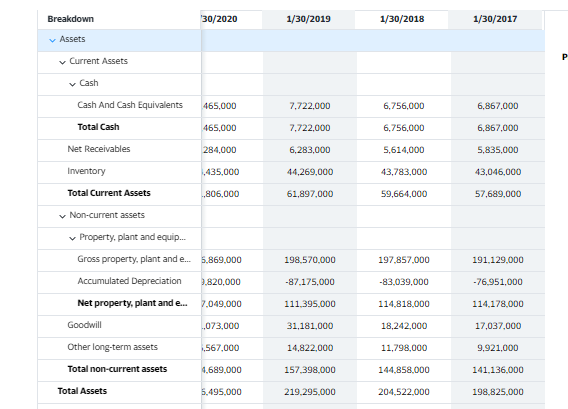
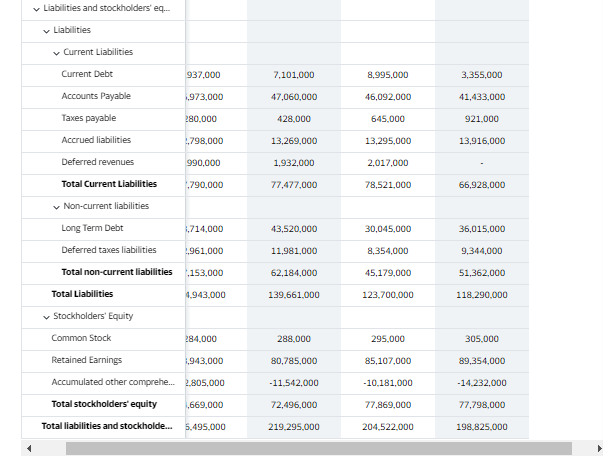
Here is the Balance Sheet in Millions (Ignore year 2020):
More Information if Required:
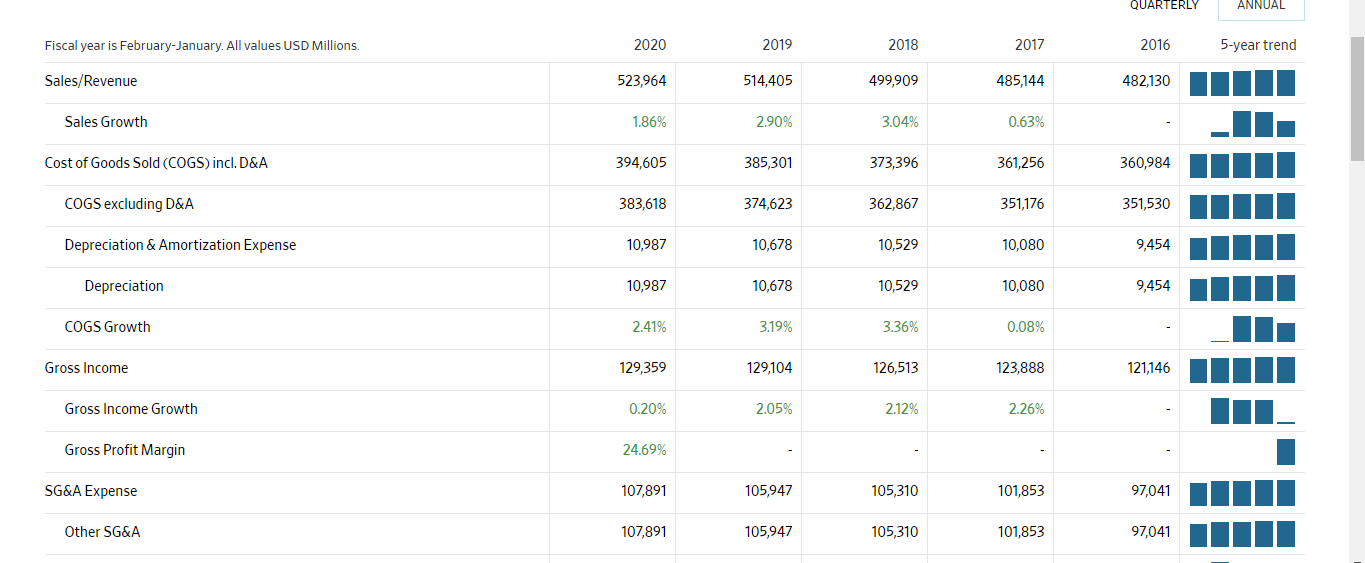
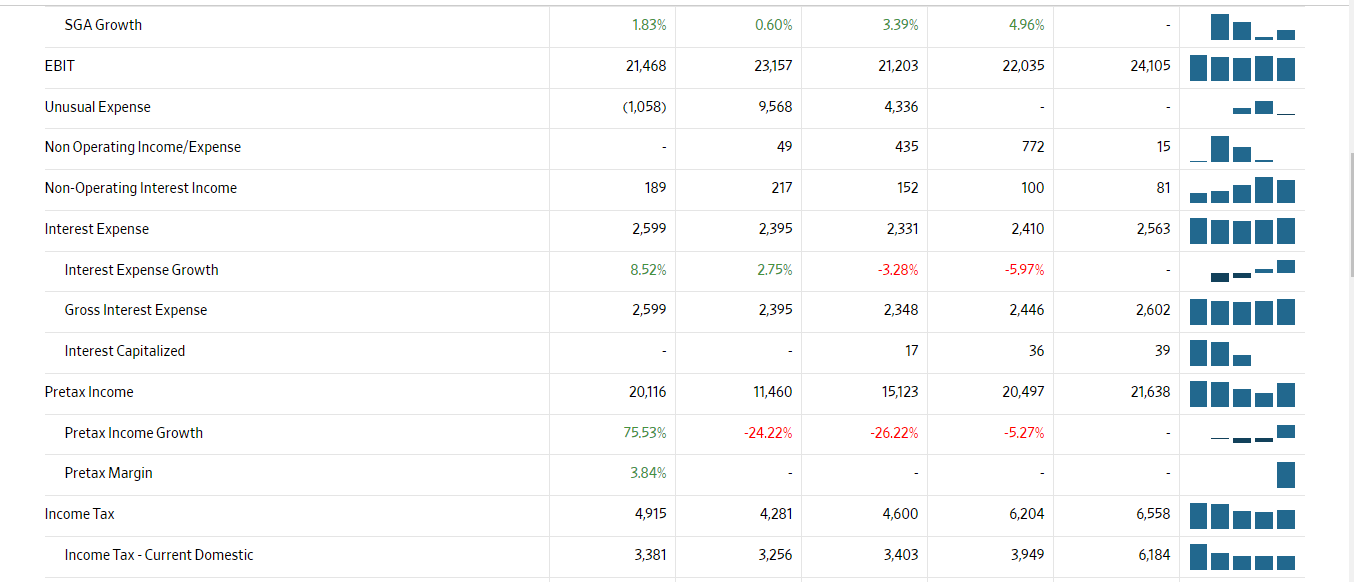
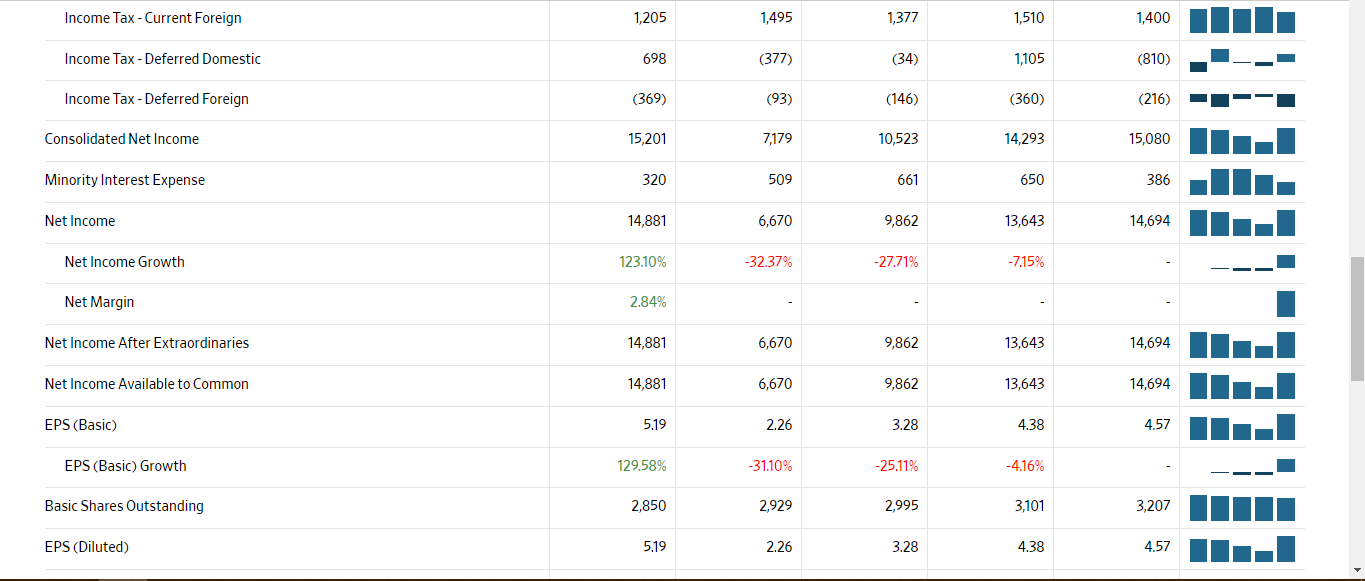
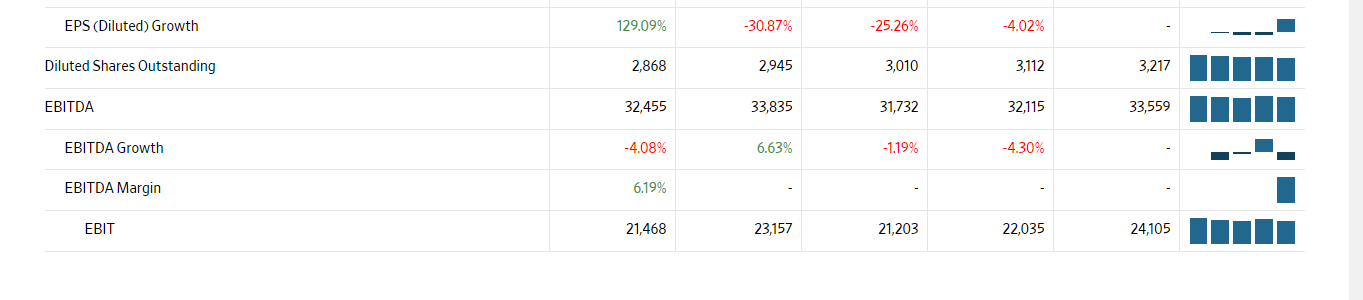
Breakdown 020 1/30/2019 1/30/2018 1/30/2017 Total Revenue 1,000 514,405,000 500.343,000 485,873,000 Prem Cost of Revenue 5,000 385.301,000 373.396,000 361,256,000 Gross Profit 9,000 129.104,000 126.947.000 124.617,000 Operating Expenses Selling General and Administrati... 1,000 107.147,000 101,853,000 Total Operating Expenses 1.000 107,147,000 106.510,000 101,853,000 Operating Income or Loss 000 21,957,000 20,437,000 22,764,000 Interest Expense 000 2.346,000 2,330,000 2,367,000 Total Other Income/Expenses Net 000 -8,368,000 -3,136.000 Income Before Tax ,000 11,460,000 15,123,000 20,497,000 Income Tax Expense 000 4,281,000 4,600,000 6,204,000 Income from Continuing Operations ,000 7,179,000 10,523,000 14,293,000 Net Income ,000 6,670,000 9,862,000 13,643,000 Net Income available to common S 000 6,670,000 9,862,000 13,643,000 Basic EPS 2.28 3.29 4.40 Diluted EPS 2.26 3.28 4.38 Basic Average Shares 2,929,000 2.995,000 3,101,000 Diluted Average Shares 2.945,000 3,010,000 3,112,000 EBITDA ,000 24.484,000 27,982,000 32.944,000 Breakdown 30/2020 1/30/2019 1/30/2018 1/30/2017 Assets Current Assets Cash Cash And Cash Equivalents 465,000 7.722.000 6,756,000 6,867,000 Total Cash 465,000 7.722.000 6,756,000 6,867,000 Net Receivables 284,000 6,283,000 5,614,000 5,835,000 Inventory 1435,000 44,269,000 43,783,000 43,046,000 Total Current Assets ,806,000 61,897,000 59,664,000 57,689,000 Non-current assets Property, plant and equip... Gross property, plant and e... 5.869.000 198,570,000 197,857,000 191,129.000 Accumulated Depreciation 3.820.000 -87.175.000 -83.039,000 -76,951,000 Net property, plant and e... 7.049,000 111.395,000 114.818,000 114,178,000 Goodwill ..073,000 31,181,000 18.242,000 17.037.000 Other long-term assets -567,000 14,822,000 11,798,000 9,921,000 Total non-current assets 4.689.000 157,398,000 144.858.000 141.136,000 Total Assets 5.495.000 219.295,000 204.522.000 198.825.000 Liabilities and stockholders' eq... Liabilities Current Liabilities Current Debt 937,000 7,101,000 8.995.000 3,355,000 Accounts Payable ,973,000 47,060,000 46,092,000 41,433,000 Taxes payable 280.000 428,000 645.000 921,000 Accrued liabilities 1.798,000 13,269,000 13,295,000 13,916,000 Deferred revenues 990.000 1,932,000 2,017,000 Total Current Liabilities .790,000 77,477,000 78,521,000 66,928,000 Non-current liabilities Long Term Debt 1,714,000 43,520,000 30.045,000 36,015,000 Deferred taxes liabilities 1,961,000 11,981,000 8,354.000 9,344,000 Total non-current liabilities 153,000 62,184,000 45,179,000 51,362,000 Total Liabilities 4.943,000 139.661.000 123.700.000 118.290.000 Stockholders' Equity Common Stock 284.000 288,000 295.000 305,000 Retained Earnings 1943,000 80,785,000 85,107,000 89,354,000 Accumulated other comprehe. 2.805,000 -11.542.000 -10,181,000 -14,232,000 Total stockholders' equity ,669,000 72,496,000 77,869,000 77,798,000 Total liabilities and stockholde. 5.495.000 219.295.000 204.522,000 198,825.000 QUARTERLY ANNUAL Fiscal year is February-January. All values USD Millions 2020 2019 2018 2017 2016 5-year trend Sales/Revenue 523,964 514,405 499,909 485,144 482,130 IIIII Sales Growth 1.86% 2.90% 3.04% 0.63% Cost of Goods Sold (COGS) incl. D&A 394,605 385,301 373,396 361,256 COGS excluding D&A 383,618 374,623 362,867 351,176 360,984 I 351,530 III 9,454 IIIII Depreciation & Amortization Expense 10,987 10,678 10,529 10,080 Depreciation 10,987 10,678 10,529 9,454 COGS Growth 2.41% 3.19% 3.36% 0.08% Gross Income 129,359 129,104 126,513 123,888 121,146 IIIII Gross Income Growth 0.20% 2.05% 2.12% 2.26% Gross Profit Margin 24.69% SG&A Expense 107,891 105,947 105,310 101,853 97,041 llll Other SG&A 107,891 105,947 105,310 101,853 97,041 SGA Growth 1.83% 0.60% 3.39% 4.96% EBIT 21,468 23,157 21,203 22,035 24,105 liil Unusual Expense (1,058) 9,568 4,336 Non Operating Income/Expense 49 435 772 Non-Operating Interest Income 189 217 152 100 Interest Expense 2,599 2,395 2,331 2,410 2,563 liill Interest Expense Growth 8.52% 2.75% -3.28% -5.97% Gross Interest Expense 2,599 2,395 2,348 2,446 2,602 Interest Capitalized 17 36 Pretax Income 20,116 11,460 15,123 20,497 21,638 III Pretax Income Growth 75.53% -24.22% -26.22% -5.27% Pretax Margin 3.84% Income Tax 4,915 4,281 4,600 6,204 6,558 Ilul 6,184 m Income Tax - Current Domestic 3,381 3,256 3,403 3,949 Income Tax - Current Foreign 1,205 1,495 1,377 1,510 1,400 Ilil. (810) ----- Income Tax-Deferred Domestic 698 (377) (34) 1,105 (810) Income Tax-Deferred Foreign (369) (93) (146) (360) (216) Consolidated Net Income 15,201 7,179 10,523 14,293 15,080 320 509 661 650 15,080 III 386 ulli. 14,694 11.1 Net Income 14,881 6,670 9,862 13,643 Net Income Growth 123.10% -32.37% -27.71% -7.15% Net Margin 2.84% Net Income After Extraordinaries 14,881 6,670 9,862 13,643 Net Income Available to Common 14,881 6,670 9,862 13,643 14,694 Ili 14,694 lla 4.57 III EPS (Basic) 5.19 2.26 3.28 4.38 EPS (Basic) Growth 129.58% -31.10% -25.11% -4.16% Basic Shares Outstanding 2,850 2,929 2,995 3,101 3,207 IIIII 4.57 III EPS (Diluted) 5.19 2.26 3.28 4.38 EPS (Diluted) Growth 129.09% -30.87% -25.26% -4.02% Diluted Shares Outstanding 2,868 2,945 3,010 3,112 3,217 IIIII 33,559 IIIII EBITDA 32,455 33,835 31,732 32,115 EBITDA Growth -4.08% 6.63% -1.19% -4.30% EBITDA Margin 6.19% EBIT 21,468 23,157 21,203 22,035 24,105 liilu