Answered step by step
Verified Expert Solution
Question
1 Approved Answer
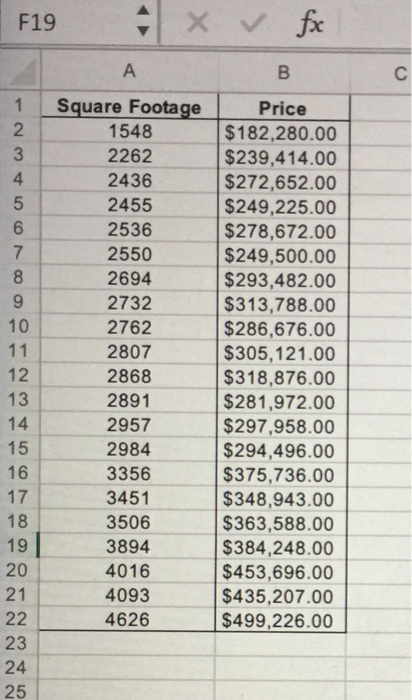
This question provides just the information here, there is no sizes of house showing in the question. The following graph plots the price versus the


This question provides just the information here, there is no sizes of house showing in the question. The following graph plots the price versus the square footage of a house. We fitted a linear trend line to the data. If you need the size for part (b), I think 95% of the variations in the home value are explained by variations in the house size. please make sure about it and be clear how you doing it. Thanks.
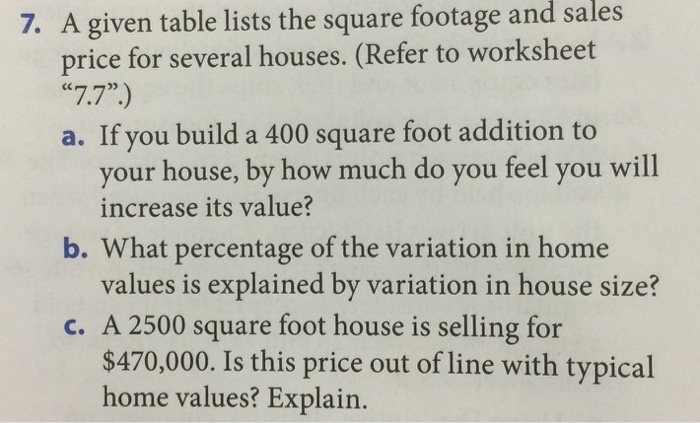
7. A given table lists the square footage and sales price for several houses. (Refer to worksheet "7.7" If you build a 400 square foot addition to your house, by how much do you feel you will increase its value? . b. What percentage of the variation in home values is explained by variation in house size? c. A 2500 square foot house is selling for $470,000. Is this price out of line with typical home values? Explain. x fx X F19 A Square Footage Price 1548 $182,280.00 $239,414.00 $272,652.00 $249,225.00 $278,672.00 $249,500.00 $293,482.00 $313,788.00 $286,676.00 $305,121.00 $318,876.00 $281,972.00 $297,958.00 $294,496.00 $375,736.00 $348,943.00 $363,588.00 $384,248.00 $453,696.00 $435,207.00 $499,226.00 2262 4 2436 2455 6 2536 7 2550 2694 2732 10 2762 11 2807 12 2868 13 2891 14 2957 15 2984 16 3356 17 3451 18 3506 19 3894 20 4016 21 4093 22 4626 23 24 25 123
Step by Step Solution
There are 3 Steps involved in it
Step: 1

Get Instant Access to Expert-Tailored Solutions
See step-by-step solutions with expert insights and AI powered tools for academic success
Step: 2

Step: 3

Ace Your Homework with AI
Get the answers you need in no time with our AI-driven, step-by-step assistance
Get Started


