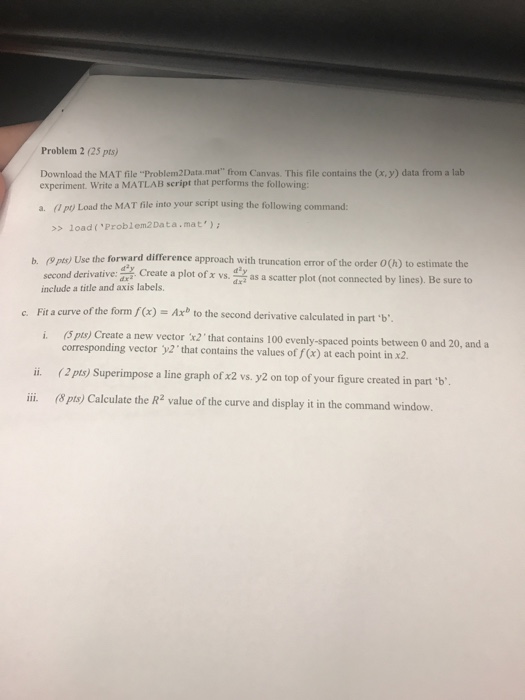
Question: This question uses matlab Problem 2 (25 pts) Download the MAT file Problem2Data.mat from Canvas. This file contains the (x, y) data from a lab

Problem 2 (25 pts) Download the MAT file Problem2Data.mat" from Canvas. This file contains the (x, y) data from a lab experiment. Write a MATLAB script that performs the following: a. ( pty Load the MAT file into your scrpt using the following command: >load('Problem2Data.mat b. ps) Use the forward difference approach with truncation error of the order O(h) to estimate the as a scatter plot(not connected by lines). Be sure to cond derivative ar Create a plot ofx vs. a include a title and axis labels. Fit a curve of the form f (x) Axb to the second derivative calculated in part . b.. i (5 pts) Create a new vector 'x2' that contains 100 evenly-spaced points between 0 and 20, and a c. corresponding vector y2' that contains the values of f(x) at each point in x2. ii. (2pts) Superimpose a line graph ofx2 vs. y2 on top of your figure created in part b. ili (8pts) Calculate the R2 value of the curve and display it in the command window
Step by Step Solution
There are 3 Steps involved in it

Get step-by-step solutions from verified subject matter experts


