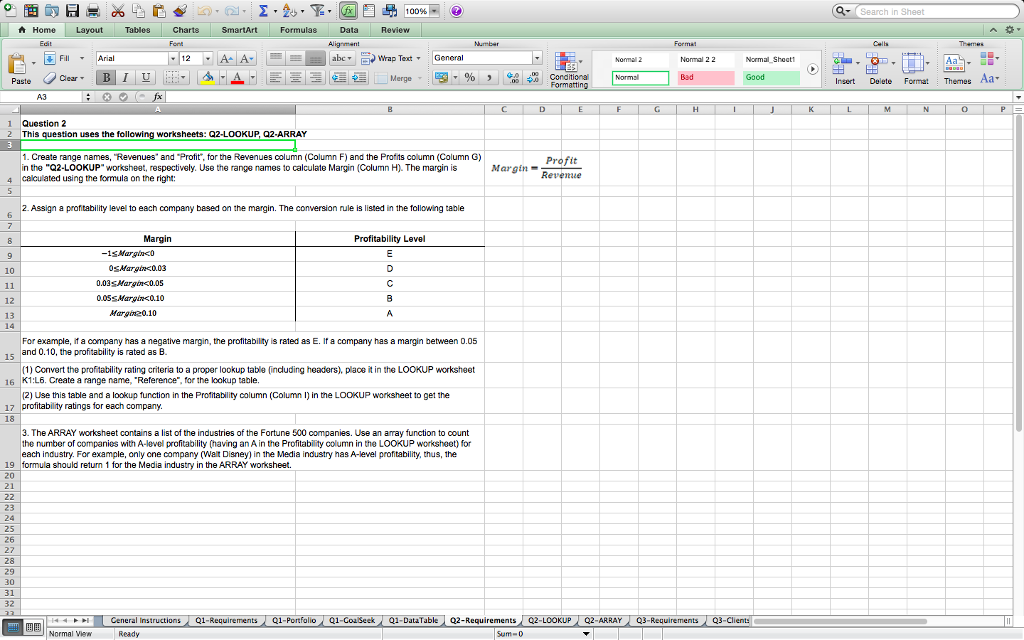
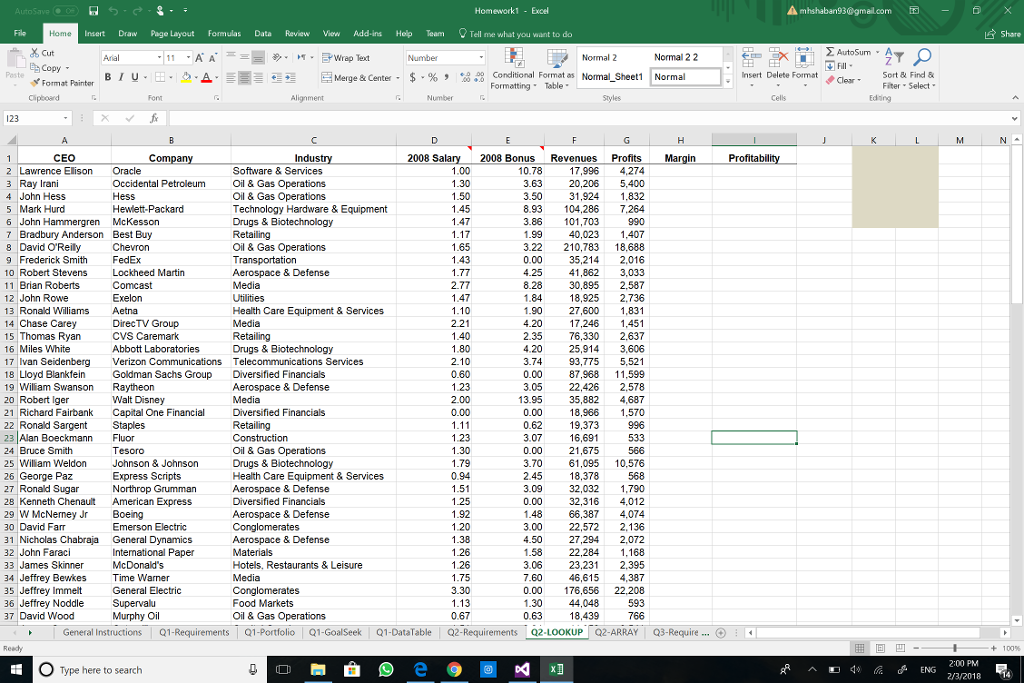
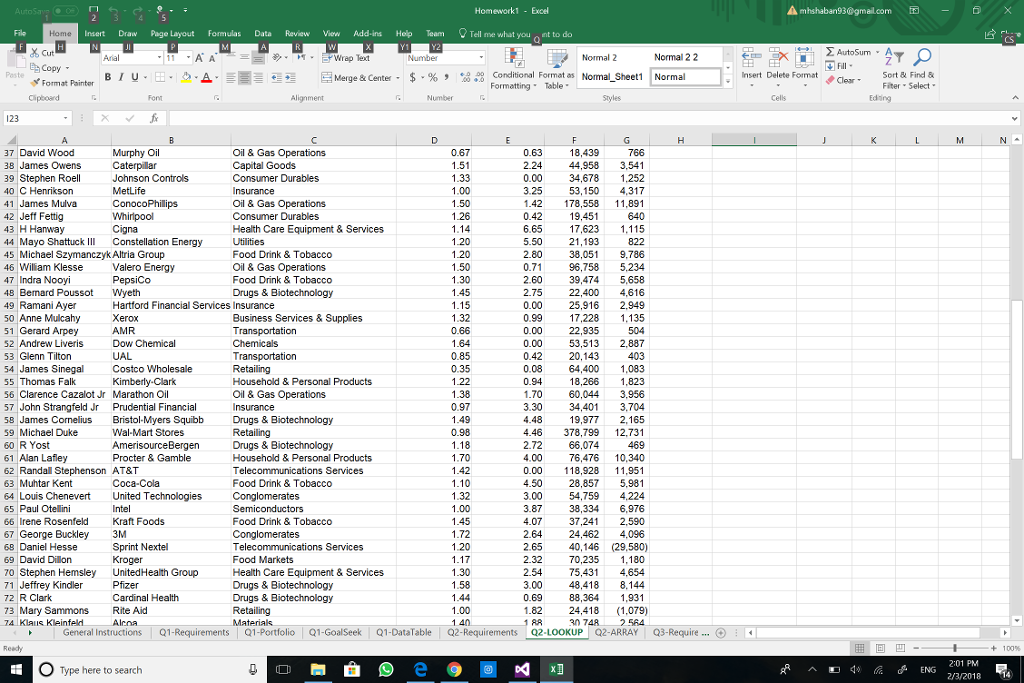
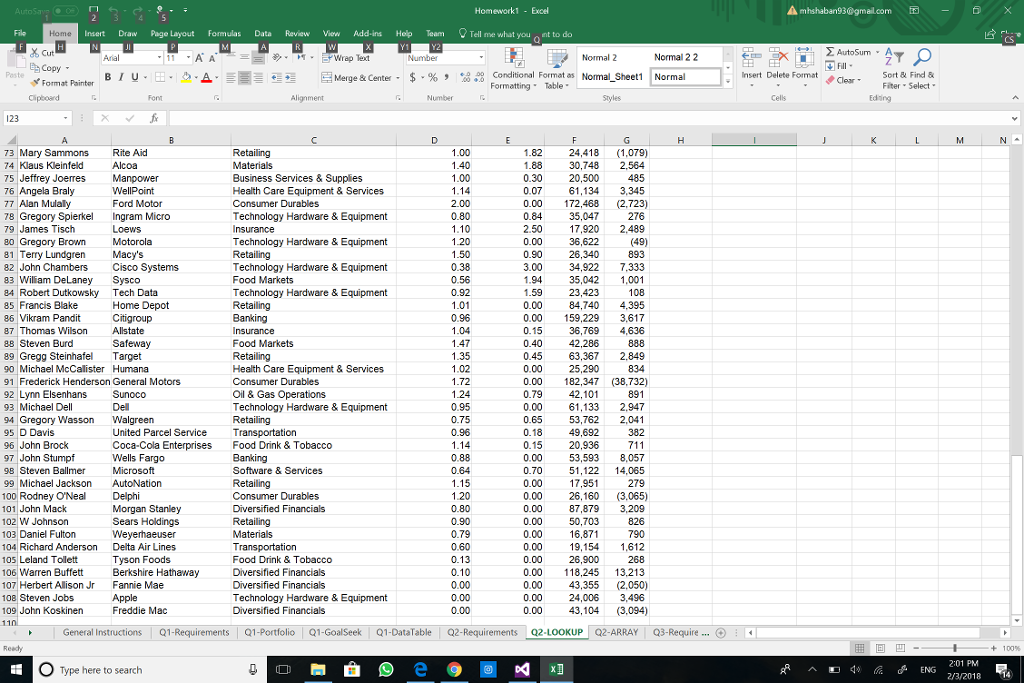
3. The ARRAY worksheet contains a list of the industries of the Fortune 500 companies. Use an array function to count the number of companies with A-level profitability (having an A in the Profitability column in the LOOKUP worksheet) for each industry. For example, only one company (Walt Disney) in the Media industry has A-level profitability, thus, the formula should return 1 for the Media industry in the ARRAY worksheet. | CEO | Company | Industry | 2008 Salary | 2008 Bonus | Revenues | Profits | Margin | Profitability | | | | | Lawrence Ellison | Oracle | Software & Services | 1.00 | 10.78 | 17,996 | 4,274 | | | | | | | Ray Irani | Occidental Petroleum | Oil & Gas Operations | 1.30 | 3.63 | 20,206 | 5,400 | | | | | | | John Hess | Hess | Oil & Gas Operations | 1.50 | 3.50 | 31,924 | 1,832 | | | | | | | Mark Hurd | Hewlett-Packard | Technology Hardware & Equipment | 1.45 | 8.93 | 104,286 | 7,264 | | | | | | | John Hammergren | McKesson | Drugs & Biotechnology | 1.47 | 3.86 | 101,703 | 990 | | | | | | | Bradbury Anderson | Best Buy | Retailing | 1.17 | 1.99 | 40,023 | 1,407 | | | | | | | David O'Reilly | Chevron | Oil & Gas Operations | 1.65 | 3.22 | 210,783 | 18,688 | | | | | | | Frederick Smith | FedEx | Transportation | 1.43 | 0.00 | 35,214 | 2,016 | | | | | | | Robert Stevens | Lockheed Martin | Aerospace & Defense | 1.77 | 4.25 | 41,862 | 3,033 | | | | | | | Brian Roberts | Comcast | Media | 2.77 | 8.28 | 30,895 | 2,587 | | | | | | | John Rowe | Exelon | Utilities | 1.47 | 1.84 | 18,925 | 2,736 | | | | | | | Ronald Williams | Aetna | Health Care Equipment & Services | 1.10 | 1.90 | 27,600 | 1,831 | | | | | | | Chase Carey | DirecTV Group | Media | 2.21 | 4.20 | 17,246 | 1,451 | | | | | | | Thomas Ryan | CVS Caremark | Retailing | 1.40 | 2.35 | 76,330 | 2,637 | | | | | | | Miles White | Abbott Laboratories | Drugs & Biotechnology | 1.80 | 4.20 | 25,914 | 3,606 | | | | | | | Ivan Seidenberg | Verizon Communications | Telecommunications Services | 2.10 | 3.74 | 93,775 | 5,521 | | | | | | | Lloyd Blankfein | Goldman Sachs Group | Diversified Financials | 0.60 | 0.00 | 87,968 | 11,599 | | | | | | | William Swanson | Raytheon | Aerospace & Defense | 1.23 | 3.05 | 22,426 | 2,578 | | | | | | | Robert Iger | Walt Disney | Media | 2.00 | 13.95 | 35,882 | 4,687 | | | | | | | Richard Fairbank | Capital One Financial | Diversified Financials | 0.00 | 0.00 | 18,966 | 1,570 | | | | | | | Ronald Sargent | Staples | Retailing | 1.11 | 0.62 | 19,373 | 996 | | | | | | | Alan Boeckmann | Fluor | Construction | 1.23 | 3.07 | 16,691 | 533 | | | | | | | Bruce Smith | Tesoro | Oil & Gas Operations | 1.30 | 0.00 | 21,675 | 566 | | | | | | | William Weldon | Johnson & Johnson | Drugs & Biotechnology | 1.79 | 3.70 | 61,095 | 10,576 | | | | | | | George Paz | Express Scripts | Health Care Equipment & Services | 0.94 | 2.45 | 18,378 | 568 | | | | | | | Ronald Sugar | Northrop Grumman | Aerospace & Defense | 1.51 | 3.09 | 32,032 | 1,790 | | | | | | | Kenneth Chenault | American Express | Diversified Financials | 1.25 | 0.00 | 32,316 | 4,012 | | | | | | | W McNerney Jr | Boeing | Aerospace & Defense | 1.92 | 1.48 | 66,387 | 4,074 | | | | | | | David Farr | Emerson Electric | Conglomerates | 1.20 | 3.00 | 22,572 | 2,136 | | | | | | | Nicholas Chabraja | General Dynamics | Aerospace & Defense | 1.38 | 4.50 | 27,294 | 2,072 | | | | | | | John Faraci | International Paper | Materials | 1.26 | 1.58 | 22,284 | 1,168 | | | | | | | James Skinner | McDonald's | Hotels, Restaurants & Leisure | 1.26 | 3.06 | 23,231 | 2,395 | | | | | | | Jeffrey Bewkes | Time Warner | Media | 1.75 | 7.60 | 46,615 | 4,387 | | | | | | | Jeffrey Immelt | General Electric | Conglomerates | 3.30 | 0.00 | 176,656 | 22,208 | | | | | | | Jeffrey Noddle | Supervalu | Food Markets | 1.13 | 1.30 | 44,048 | 593 | | | | | | | David Wood | Murphy Oil | Oil & Gas Operations | 0.67 | 0.63 | 18,439 | 766 | | | | | | | James Owens | Caterpillar | Capital Goods | 1.51 | 2.24 | 44,958 | 3,541 | | | | | | | Stephen Roell | Johnson Controls | Consumer Durables | 1.33 | 0.00 | 34,678 | 1,252 | | | | | | | C Henrikson | MetLife | Insurance | 1.00 | 3.25 | 53,150 | 4,317 | | | | | | | James Mulva | ConocoPhillips | Oil & Gas Operations | 1.50 | 1.42 | 178,558 | 11,891 | | | | | | | Jeff Fettig | Whirlpool | Consumer Durables | 1.26 | 0.42 | 19,451 | 640 | | | | | | | H Hanway | Cigna | Health Care Equipment & Services | 1.14 | 6.65 | 17,623 | 1,115 | | | | | | | Mayo Shattuck III | Constellation Energy | Utilities | 1.20 | 5.50 | 21,193 | 822 | | | | | | | Michael Szymanczyk | Altria Group | Food Drink & Tobacco | 1.20 | 2.80 | 38,051 | 9,786 | | | | | | | William Klesse | Valero Energy | Oil & Gas Operations | 1.50 | 0.71 | 96,758 | 5,234 | | | | | | | Indra Nooyi | PepsiCo | Food Drink & Tobacco | 1.30 | 2.60 | 39,474 | 5,658 | | | | | | | Bernard Poussot | Wyeth | Drugs & Biotechnology | 1.45 | 2.75 | 22,400 | 4,616 | | | | | | | Ramani Ayer | Hartford Financial Services | Insurance | 1.15 | 0.00 | 25,916 | 2,949 | | | | | | | Anne Mulcahy | Xerox | Business Services & Supplies | 1.32 | 0.99 | 17,228 | 1,135 | | | | | | | Gerard Arpey | AMR | Transportation | 0.66 | 0.00 | 22,935 | 504 | | | | | | | Andrew Liveris | Dow Chemical | Chemicals | 1.64 | 0.00 | 53,513 | 2,887 | | | | | | | Glenn Tilton | UAL | Transportation | 0.85 | 0.42 | 20,143 | 403 | | | | | | | James Sinegal | Costco Wholesale | Retailing | 0.35 | 0.08 | 64,400 | 1,083 | | | | | | | Thomas Falk | Kimberly-Clark | Household & Personal Products | 1.22 | 0.94 | 18,266 | 1,823 | | | | | | | Clarence Cazalot Jr | Marathon Oil | Oil & Gas Operations | 1.38 | 1.70 | 60,044 | 3,956 | | | | | | | John Strangfeld Jr | Prudential Financial | Insurance | 0.97 | 3.30 | 34,401 | 3,704 | | | | | | | James Cornelius | Bristol-Myers Squibb | Drugs & Biotechnology | 1.49 | 4.48 | 19,977 | 2,165 | | | | | | | Michael Duke | Wal-Mart Stores | Retailing | 0.98 | 4.46 | 378,799 | 12,731 | | | | | | | R Yost | AmerisourceBergen | Drugs & Biotechnology | 1.18 | 2.72 | 66,074 | 469 | | | | | | | Alan Lafley | Procter & Gamble | Household & Personal Products | 1.70 | 4.00 | 76,476 | 10,340 | | | | | | | Randall Stephenson | AT&T | Telecommunications Services | 1.42 | 0.00 | 118,928 | 11,951 | | | | | | | Muhtar Kent | Coca-Cola | Food Drink & Tobacco | 1.10 | 4.50 | 28,857 | 5,981 | | | | | | | Louis Chenevert | United Technologies | Conglomerates | 1.32 | 3.00 | 54,759 | 4,224 | | | | | | | Paul Otellini | Intel | Semiconductors | 1.00 | 3.87 | 38,334 | 6,976 | | | | | | | Irene Rosenfeld | Kraft Foods | Food Drink & Tobacco | 1.45 | 4.07 | 37,241 | 2,590 | | | | | | | George Buckley | 3M | Conglomerates | 1.72 | 2.64 | 24,462 | 4,096 | | | | | | | Daniel Hesse | Sprint Nextel | Telecommunications Services | 1.20 | 2.65 | 40,146 | (29,580) | | | | | | | David Dillon | Kroger | Food Markets | 1.17 | 2.32 | 70,235 | 1,180 | | | | | | | Stephen Hemsley | UnitedHealth Group | Health Care Equipment & Services | 1.30 | 2.54 | 75,431 | 4,654 | | | | | | | Jeffrey Kindler | Pfizer | Drugs & Biotechnology | 1.58 | 3.00 | 48,418 | 8,144 | | | | | | | R Clark | Cardinal Health | Drugs & Biotechnology | 1.44 | 0.69 | 88,364 | 1,931 | | | | | | | Mary Sammons | Rite Aid | Retailing | 1.00 | 1.82 | 24,418 | (1,079) | | | | | | | Klaus Kleinfeld | Alcoa | Materials | 1.40 | 1.88 | 30,748 | 2,564 | | | | | | | Jeffrey Joerres | Manpower | Business Services & Supplies | 1.00 | 0.30 | 20,500 | 485 | | | | | | | Angela Braly | WellPoint | Health Care Equipment & Services | 1.14 | 0.07 | 61,134 | 3,345 | | | | | | | Alan Mulally | Ford Motor | Consumer Durables | 2.00 | 0.00 | 172,468 | (2,723) | | | | | | | Gregory Spierkel | Ingram Micro | Technology Hardware & Equipment | 0.80 | 0.84 | 35,047 | 276 | | | | | | | James Tisch | Loews | Insurance | 1.10 | 2.50 | 17,920 | 2,489 | | | | | | | Gregory Brown | Motorola | Technology Hardware & Equipment | 1.20 | 0.00 | 36,622 | (49) | | | | | | | Terry Lundgren | Macy's | Retailing | 1.50 | 0.90 | 26,340 | 893 | | | | | | | John Chambers | Cisco Systems | Technology Hardware & Equipment | 0.38 | 3.00 | 34,922 | 7,333 | | | | | | | William DeLaney | Sysco | Food Markets | 0.56 | 1.94 | 35,042 | 1,001 | | | | | | | Robert Dutkowsky | Tech Data | Technology Hardware & Equipment | 0.92 | 1.59 | 23,423 | 108 | | | | | | | Francis Blake | Home Depot | Retailing | 1.01 | 0.00 | 84,740 | 4,395 | | | | | | | Vikram Pandit | Citigroup | Banking | 0.96 | 0.00 | 159,229 | 3,617 | | | | | | | Thomas Wilson | Allstate | Insurance | 1.04 | 0.15 | 36,769 | 4,636 | | | | | | | Steven Burd | Safeway | Food Markets | 1.47 | 0.40 | 42,286 | 888 | | | | | | | Gregg Steinhafel | Target | Retailing | 1.35 | 0.45 | 63,367 | 2,849 | | | | | | | Michael McCallister | Humana | Health Care Equipment & Services | 1.02 | 0.00 | 25,290 | 834 | | | | | | | Frederick Henderson | General Motors | Consumer Durables | 1.72 | 0.00 | 182,347 | (38,732) | | | | | | | Lynn Elsenhans | Sunoco | Oil & Gas Operations | 1.24 | 0.79 | 42,101 | 891 | | | | | | | Michael Dell | Dell | Technology Hardware & Equipment | 0.95 | 0.00 | 61,133 | 2,947 | | | | | | | Gregory Wasson | Walgreen | Retailing | 0.75 | 0.65 | 53,762 | 2,041 | | | | | | | D Davis | United Parcel Service | Transportation | 0.96 | 0.18 | 49,692 | 382 | | | | | | | John Brock | Coca-Cola Enterprises | Food Drink & Tobacco | 1.14 | 0.15 | 20,936 | 711 | | | | | | | John Stumpf | Wells Fargo | Banking | 0.88 | 0.00 | 53,593 | 8,057 | | | | | | | Steven Ballmer | Microsoft | Software & Services | 0.64 | 0.70 | 51,122 | 14,065 | | | | | | | Michael Jackson | AutoNation | Retailing | 1.15 | 0.00 | 17,951 | 279 | | | | | | | Rodney O'Neal | Delphi | Consumer Durables | 1.20 | 0.00 | 26,160 | (3,065) | | | | | | | John Mack | Morgan Stanley | Diversified Financials | 0.80 | 0.00 | 87,879 | 3,209 | | | | | | | W Johnson | Sears Holdings | Retailing | 0.90 | 0.00 | 50,703 | 826 | | | | | | | Daniel Fulton | Weyerhaeuser | Materials | 0.79 | 0.00 | 16,871 | 790 | | | | | | | Richard Anderson | Delta Air Lines | Transportation | 0.60 | 0.00 | 19,154 | 1,612 | | | | | | | Leland Tollett | Tyson Foods | Food Drink & Tobacco | 0.13 | 0.00 | 26,900 | 268 | | | | | | | Warren Buffett | Berkshire Hathaway | Diversified Financials | 0.10 | 0.00 | 118,245 | 13,213 | | | | | | | Herbert Allison Jr | Fannie Mae | Diversified Financials | 0.00 | 0.00 | 43,355 | (2,050) | | | | | | | Steven Jobs | Apple | Technology Hardware & Equipment | 0.00 | 0.00 | 24,006 | 3,496 | | | | | | | John Koskinen | Freddie Mac | Diversified Financials | 0.00 | 0.00 | 43,104 | (3,094) | | | | | | |
