Answered step by step
Verified Expert Solution
Link Copied!

Question

1 Approved Answer

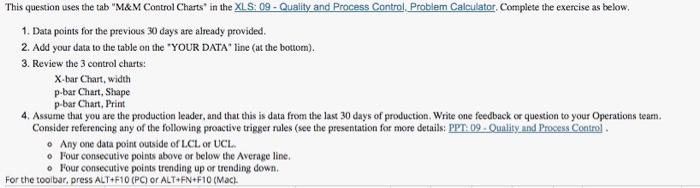
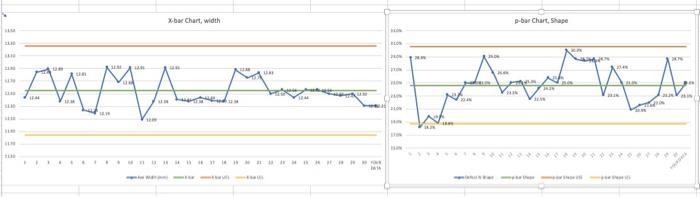
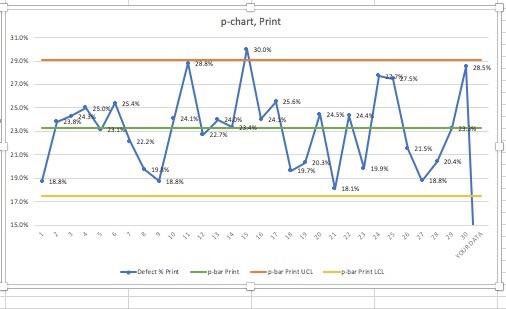
This question uses the tab M&M Control Charts in the XLS: 09 - Quality and Process Control. Problem Calculator. Complete the exercise as below. 1.

image text in transcribed
This question uses the tab "M\&M Control Charts" in the XLS: 09 - Quality and Process Control. Problem Calculator. Complete the exercise as below. 1. Data points for the previous 30 days are already provided. 2. Add your data to the table on the 'YOUR DATA' line (at the botom). 3. Review the 3 control charts: X-bar Chart, width p-bar Chart, Shape p-bar Chart, Print 4. Assume that you are the production leader, and that this is data from the last 30 days of production. Write one feedback or question to your Operations team. Consider referencing any of the following proactive trigger rules (see the presentation for more details: ppti 09-Quality and Process Control. - Any one data point outside of LCL or UCL. - Four consecutive points above or below the Average line. - Four consecutive points trending up of trending down. For the toolbar, press ALT+F10 (PC) or ALT+FN+F10 (MaC). p-chart, Print 310% This question uses the tab "M\&M Control Charts" in the XLS: 09 - Quality and Process Control. Problem Calculator. Complete the exercise as below. 1. Data points for the previous 30 days are already provided. 2. Add your data to the table on the 'YOUR DATA' line (at the botom). 3. Review the 3 control charts: X-bar Chart, width p-bar Chart, Shape p-bar Chart, Print 4. Assume that you are the production leader, and that this is data from the last 30 days of production. Write one feedback or question to your Operations team. Consider referencing any of the following proactive trigger rules (see the presentation for more details: ppti 09-Quality and Process Control. - Any one data point outside of LCL or UCL. - Four consecutive points above or below the Average line. - Four consecutive points trending up of trending down. For the toolbar, press ALT+F10 (PC) or ALT+FN+F10 (MaC). p-chart, Print 310%

Step by Step Solution

There are 3 Steps involved in it

Step: 1

blur-text-image

Get Instant Access to Expert-Tailored Solutions

See step-by-step solutions with expert insights and AI powered tools for academic success

Step: 2

blur-text-image

Step: 3

blur-text-image

Ace Your Homework with AI

Get the answers you need in no time with our AI-driven, step-by-step assistance

Get Started

Recommended Textbook for

Food Hygiene Auditing

Authors: N. Chesworth

1997th Edition

1461380545, 978-1461380542

More Books

Students also viewed these Accounting questions