This references financial statements I posted below. Please reference.
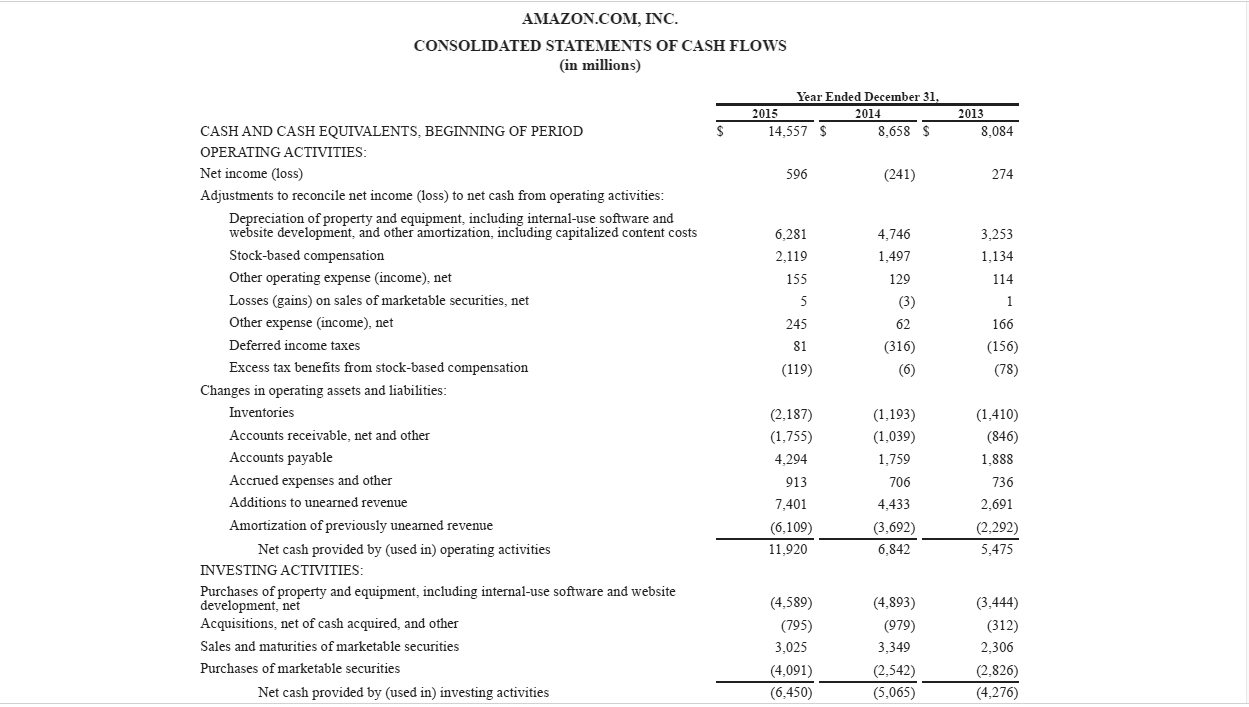

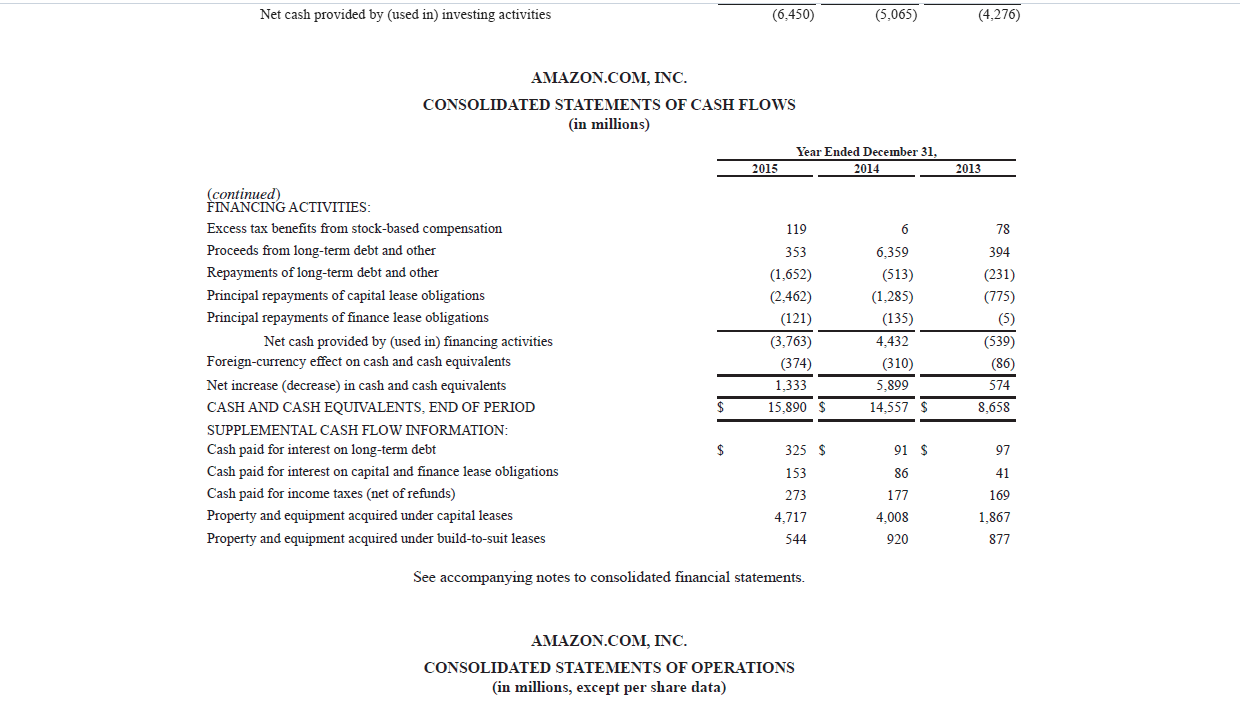
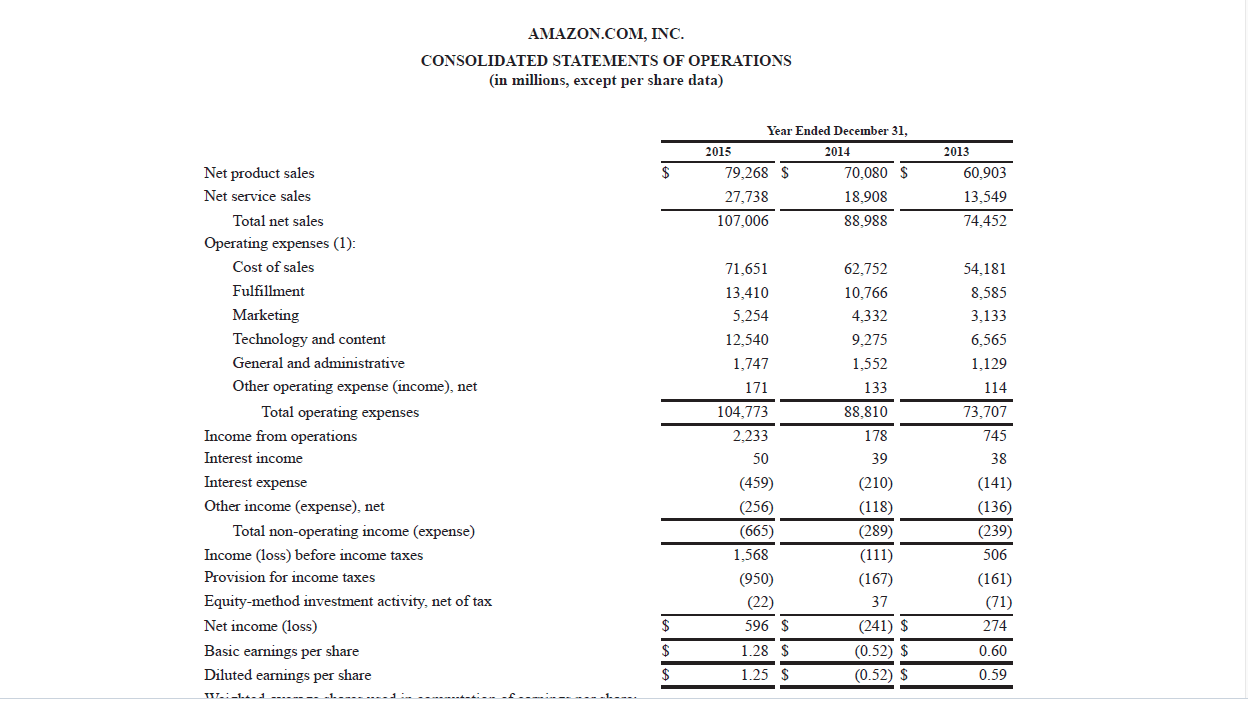
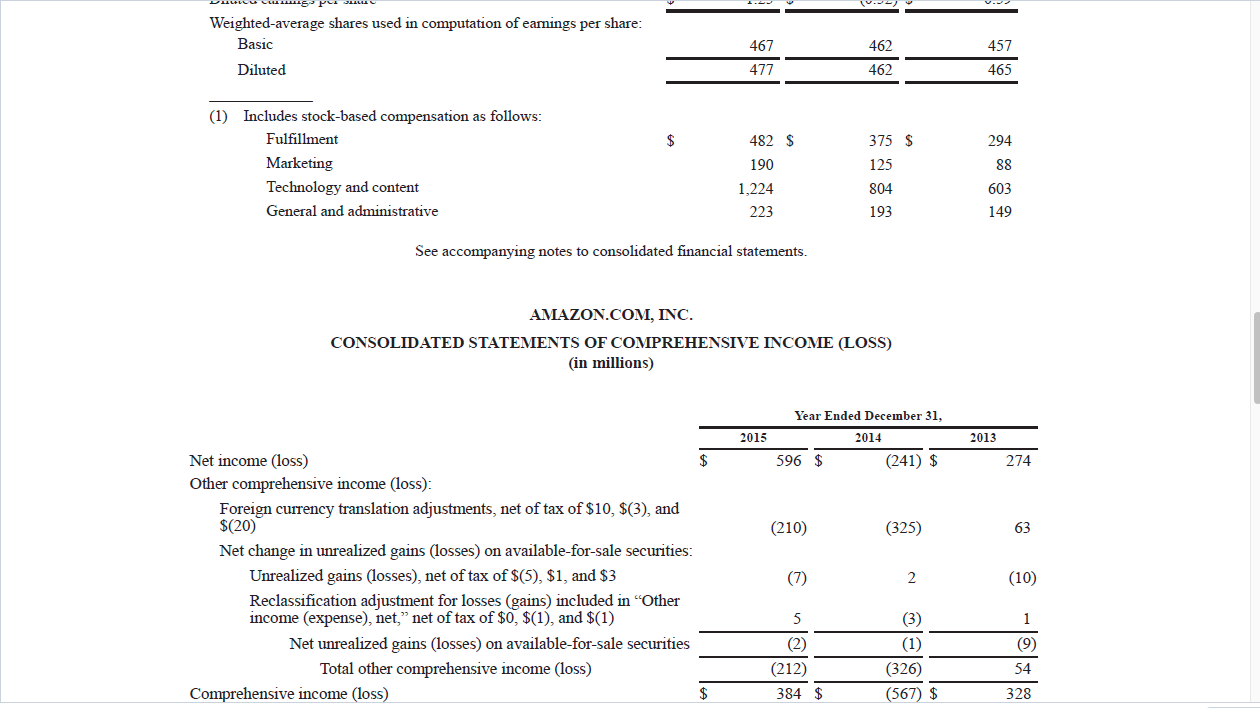
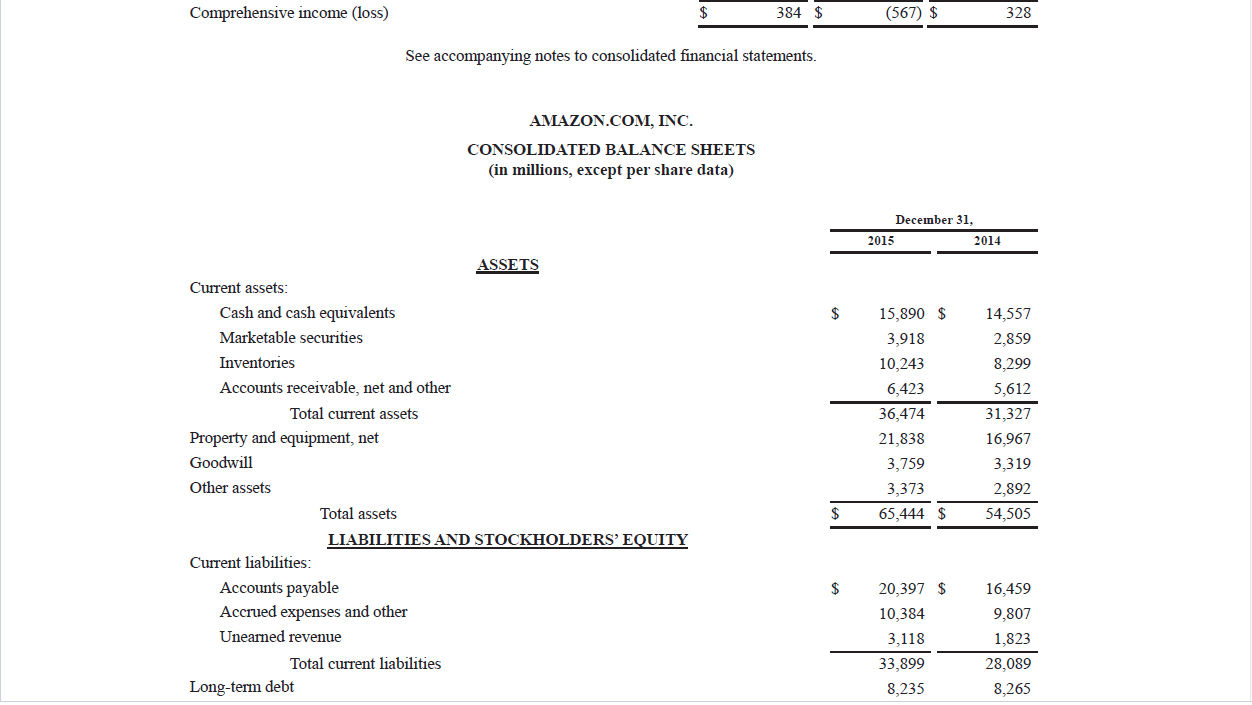
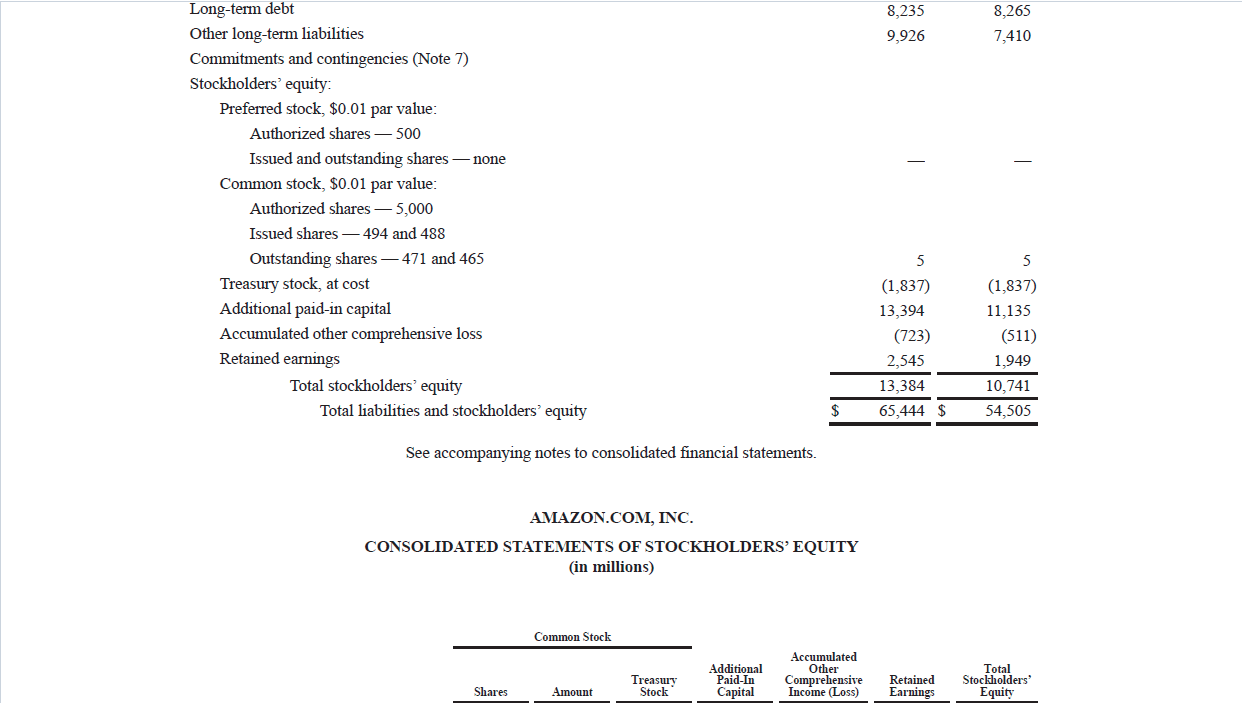
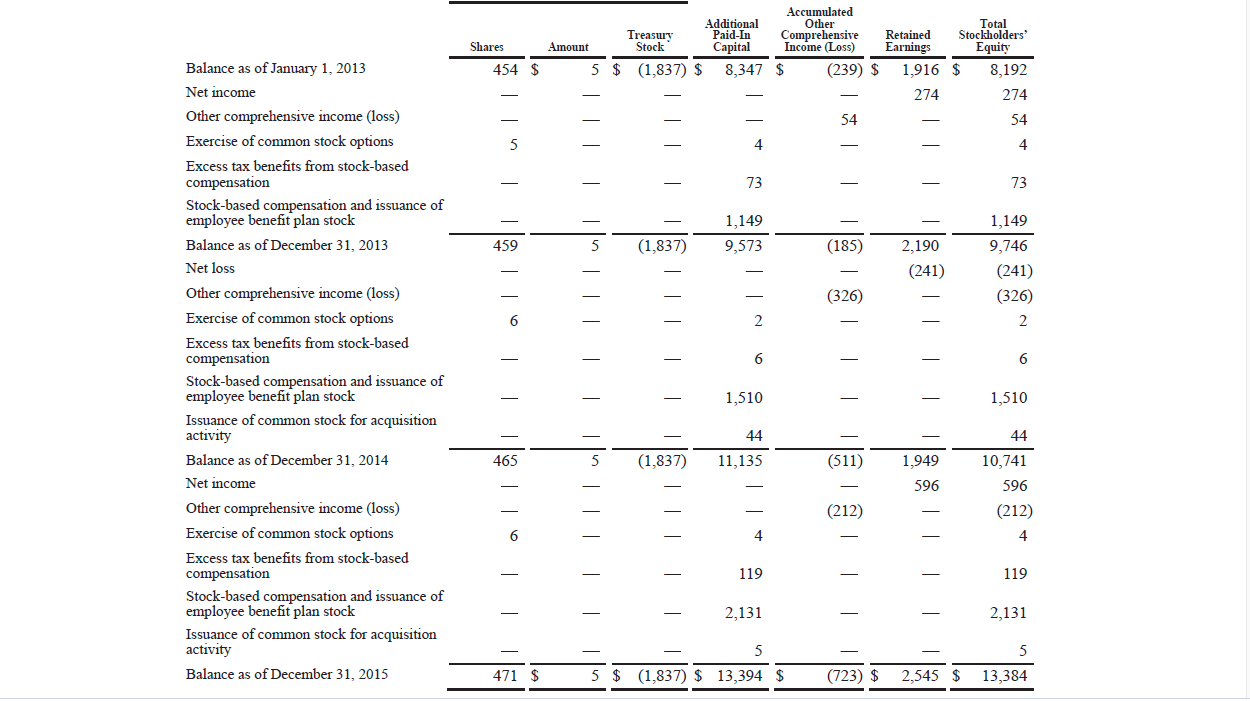

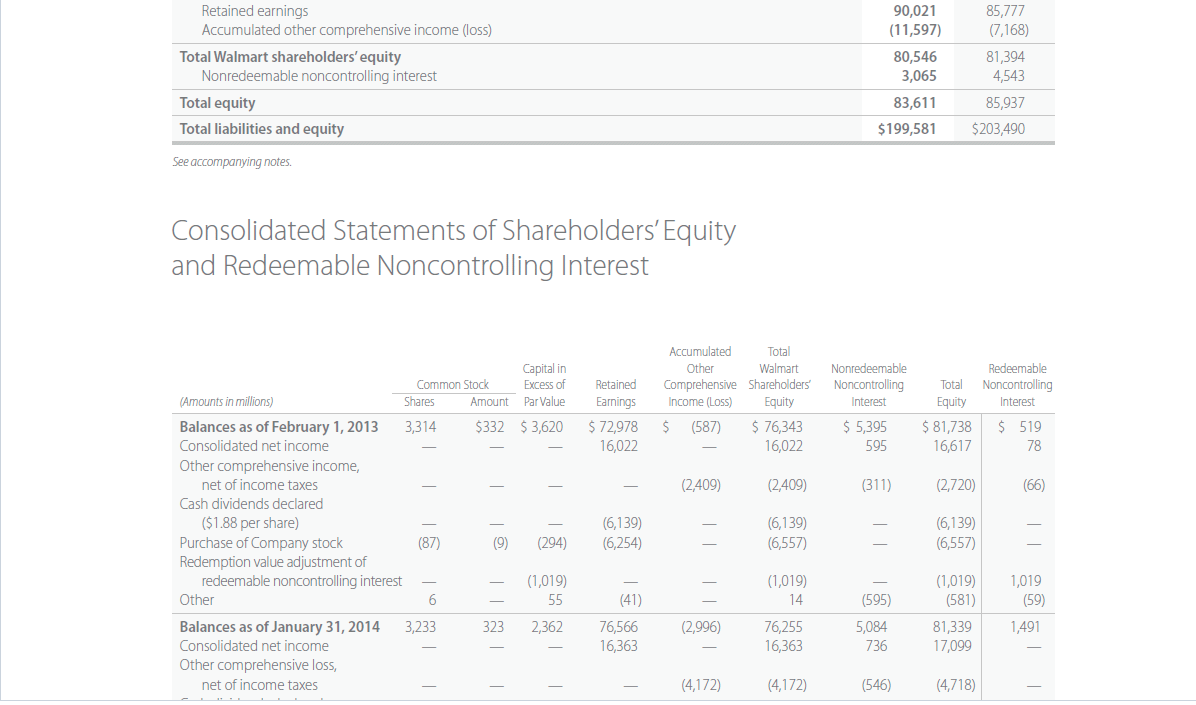
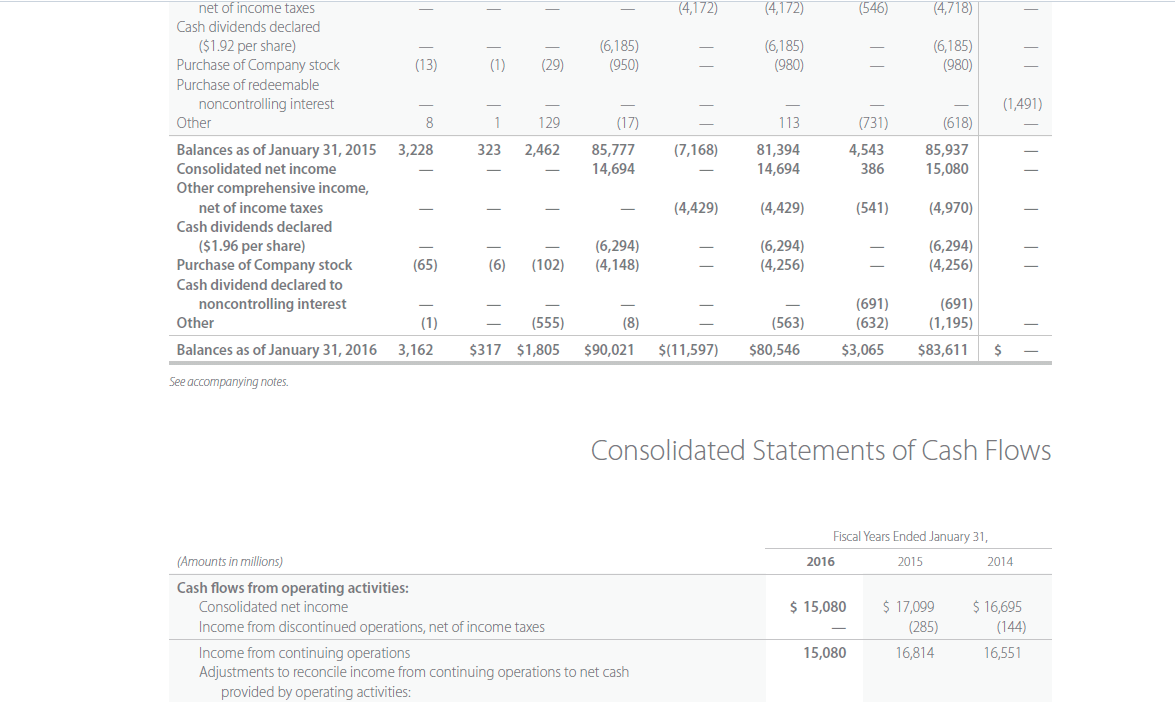
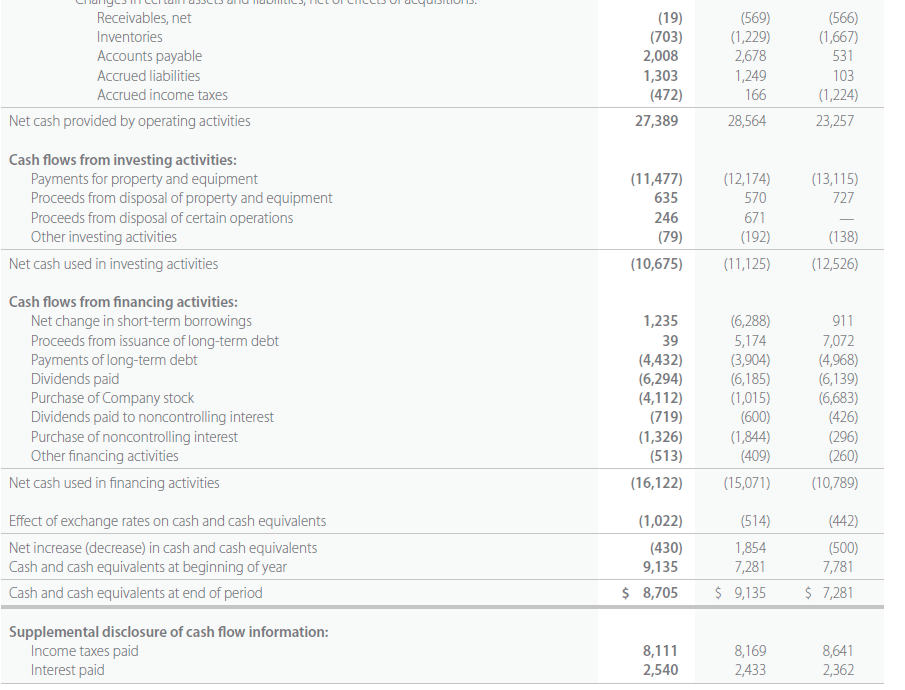
Net cash provided by (used in) investing activities (6,450) (5,065) (4,276) AMAZON.COM, INC. CONSOLIDATED STATEMENTS OF CASH FLOWS (in millions) Year Ended December 31, 2014 2015 2013 119 6 78 394 (231) (775) (5) (continued) FINANCING ACTIVITIES: Excess tax benefits from stock-based compensation Proceeds from long-term debt and other Repayments of long-term debt and other Principal repayments of capital lease obligations Principal repayments of finance lease obligations Net cash provided by (used in) financing activities Foreign-currency effect on cash and cash equivalents Net increase (decrease) in cash and cash equivalents CASH AND CASH EQUIVALENTS, END OF PERIOD SUPPLEMENTAL CASH FLOW INFORMATION: Cash paid for interest on long-term debt Cash paid for interest on capital and finance lease obligations Cash paid for income taxes (net of refunds) Property and equipment acquired under capital leases Property and equipment acquired under build-to-suit leases 353 (1,652) (2.462) (121) (3,763) (374) 1,333 15,890 $ 6,359 (513) (1.285) (135) 4.432 (310) 5,899 14,557 $ (539) (86) 574 8,658 $ $ 91 $ 97 86 41 325 $ 153 273 4,717 544 177 4,008 920 169 1.867 877 See accompanying notes to consolidated financial statements. AMAZON.COM, INC. CONSOLIDATED STATEMENTS OF OPERATIONS (in millions, except per share data) Comprehensive income (loss) $ 384 $ (567) $ 328 See accompanying notes to consolidated financial statements. AMAZON.COM, INC. CONSOLIDATED BALANCE SHEETS (in millions, except per share data) December 31, 2015 2014 ASSETS $ 14,557 2,859 8,299 Current assets: Cash and cash equivalents Marketable securities Inventories Accounts receivable, net and other Total current assets Property and equipment, net Goodwill 15,890 $ 3,918 10,243 6,423 36,474 21,838 3,759 3,373 65,444 $ 5,612 31,327 16,967 3,319 2.892 54,505 Other assets $ $ Total assets LIABILITIES AND STOCKHOLDERS' EQUITY Current liabilities: Accounts payable Accrued expenses and other Uneamed revenue Total current liabilities Long-term debt 16,459 9,807 20,397 $ 10,384 3,118 33,899 8,235 1,823 28,089 8,265 Shares Amount Accumulated Additional Other Treasury Paid-In Comprehensive Stock Capital Income (Loss) $ (1,837) $ 8,347 $ (239) $ Earnings Total Retained Stockholders' Equity 1,916 $ 8,192 274 274 454 $ 54 54 5 4 4 73 73 1,149 9,573 459 (1,837) (185) 2.190 (241) 1,149 9,746 (241) (326) (326) 2 | 6 2 6 6 | Balance as of January 1, 2013 Net income Other comprehensive income (loss) Exercise of common stock options Excess tax benefits from stock-based compensation Stock-based compensation and issuance of employee benefit plan stock Balance as of December 31, 2013 Net loss Other comprehensive income (loss) Exercise of common stock options Excess tax benefits from stock-based compensation Stock-based compensation and issuance of employee benefit plan stock Issuance of common stock for acquisition activity Balance as of December 31, 2014 Net income Other comprehensive income (loss) Exercise of common stock options Excess tax benefits from stock-based compensation Stock-based compensation and issuance of employee benefit plan stock Issuance of common stock for acquisition activity Balance as of December 31, 2015 1,510 1,510 44 44 11,135 465 (1,837) (511) 1,949 596 10,741 596 (212) (212) 6 4 4 119 119 | - - - 2,131 2,131 | 5 5 471 $ 5 $ (1,837) $ 13,394 $ (723) $ 2,545 $ 13,384 APPENDIX E Specimen Financial Statements: Wal-Mart Stores, Inc. The following are Wal-Mart Stores, Inc.'s financial statements as presented in the company's 2016 annual report. The complete annual report, including notes to the financial statements, is available at the company's website. Consolidated Statements of Income Fiscal Years Ended January 31, 2016 2015 2014 $478,614 3,516 482,130 $482,229 3,422 485,651 $473,076 3,218 476,294 360,984 97,041 24,105 365,086 93,418 27,147 358,069 91,353 26,872 (Amounts in millions, except per share data) Revenues: Net sales Membership and other income Total revenues Costs and expenses: Cost of sales Operating, selling, general and administrative expenses Operating income Interest: Debt Capital lease and financing obligations Interest income Interest, net Income from continuing operations before income taxes Provision for income taxes: Current Deferred Total provision for income taxes Income from continuing operations 2,027 521 (81) 2,467 2,161 300 (113) 2,348 2,072 263 (119) 2,216 21,638 24,799 24,656 7,584 8,619 (1,026) 6,558 15,080 8,504 (519) 7,985 16,814 (514) 8,105 16,551 Net cash provided by (used in) investing activities (6,450) (5,065) (4,276) AMAZON.COM, INC. CONSOLIDATED STATEMENTS OF CASH FLOWS (in millions) Year Ended December 31, 2014 2015 2013 119 6 78 394 (231) (775) (5) (continued) FINANCING ACTIVITIES: Excess tax benefits from stock-based compensation Proceeds from long-term debt and other Repayments of long-term debt and other Principal repayments of capital lease obligations Principal repayments of finance lease obligations Net cash provided by (used in) financing activities Foreign-currency effect on cash and cash equivalents Net increase (decrease) in cash and cash equivalents CASH AND CASH EQUIVALENTS, END OF PERIOD SUPPLEMENTAL CASH FLOW INFORMATION: Cash paid for interest on long-term debt Cash paid for interest on capital and finance lease obligations Cash paid for income taxes (net of refunds) Property and equipment acquired under capital leases Property and equipment acquired under build-to-suit leases 353 (1,652) (2.462) (121) (3,763) (374) 1,333 15,890 $ 6,359 (513) (1.285) (135) 4.432 (310) 5,899 14,557 $ (539) (86) 574 8,658 $ $ 91 $ 97 86 41 325 $ 153 273 4,717 544 177 4,008 920 169 1.867 877 See accompanying notes to consolidated financial statements. AMAZON.COM, INC. CONSOLIDATED STATEMENTS OF OPERATIONS (in millions, except per share data) 1,027 6,558 15,080 7,985 16,814 285 17,099 (736) $ 16,363 11 8,105 16,551 144 16,695 (673) $ 16,022 15,080 (386) $ 14,694 $ 4.58 $ $ 5.01 0.06 4.87 0.03 Total provision for income taxes Income from continuing operations Income from discontinued operations, net of income taxes Consolidated net income Consolidated net income attributable to noncontrolling interest Consolidated net income attributable to Walmart Basic net income per common share: Basic income per common share from continuing operations attributable to Walmart Basic income per common share from discontinued operations attributable to Walmart Basic net income per common share attributable to Walmart Diluted net income per common share: Diluted income per common share from continuing operations attributable to Walmart Diluted income per common share from discontinued operations attributable to Walmart Diluted net income per common share attributable to Walmart Weighted average common shares outstanding: Basic Diluted Dividends declared per common share $ 4.58 $ 5.07 $ 4.90 $ 4.57 $ $ 4.99 0.06 4.85 0.03 $ 4.57 $ 5.05 $ 4.88 3,207 3,230 3,243 3.269 3,283 3,217 1.96 $ $ 1.92 $ 1.88 See accompanying notes. Consolidated Statements of Comprehensive Income (Amounts in millions) Consolidated net income Less consolidated net income attributable to nonredeemable noncontrolling interest Less consolidated net income attributable to redeemable noncontrolling interest Consolidated net income attributable to Walmart Fiscal Years Ended January 31, 2016 2015 2014 $15,080 $17,099 $16,695 (386) (736) (606) (67) 14,694 16,363 16,022 Other comprehensive income (lossl net of income taxes 14,694 16,363 16,022 (4,558) 379 (5,220) 366 (202) 86 (3,221) 75 207 153 (470) (69) Consolidated net income attributable to Walmart Other comprehensive income (loss), net of income taxes Currency translation and other Net investment hedges Cash flow hedges Minimum pension liability Other comprehensive income (loss), net of income taxes Less other comprehensive income (loss) attributable to nonredeemable noncontrolling interest Less other comprehensive income (loss) attributable to redeemable noncontrolling interest Other comprehensive income (loss) attributable to Walmart Comprehensive income, net of income taxes Less comprehensive income (loss) attributable to nonredeemable noncontrolling interest Less comprehensive income (loss) attributable to redeemable noncontrolling interest Comprehensive income attributable to Walmart (4,970) 541 (4,718) 546 (2,786 311 66 (4,429) 10,110 155 (4,172) 12,381 (190) (2,409) 13,909 (295) (1) $10,265 $12,191 $13,613 See accompanying notes. Consolidated Balance Sheets Fiscal Years Ended January 31, (Amounts in millions) 2016 2015 ASSETS Current assets: Cash and cash equivalents Receivables, net Inventories Prepaid expenses and other Total current assets Pronorty and cauinmont. $ 8,705 5,624 44,469 1,441 $ 9,135 6,778 45,141 2,224 60,239 63,278 1,441 2,224 60,239 63,278 177,395 176,958 (66,787) Prepaid expenses and other Total current assets Property and equipment: Property and equipment Less accumulated depreciation Property and equipment, net Property under capital lease and financing obligations: Property under capital lease and financing obligations Less accumulated amortization Property under capital lease and financing obligations, net Goodwill Other assets and deferred charges (63,115) 114,280 110,171 11,096 (4,751) 6,345 16,695 5,239 (2,864) 2,375 18,102 5,455 $203,490 6,131 Total assets $199,581 LIABILITIES AND EQUITY Current liabilities: Short-term borrowings Accounts payable Accrued liabilities Accrued income taxes Long-term debt due within one year Capital lease and financing obligations due within one year Total current liabilities $ 2,708 38,487 19,607 521 2,745 551 $ 1,592 38,410 19,152 1,021 4,791 287 64,619 65,253 40,889 Long-term debt Long-term capital lease and financing obligations Deferred income taxes and other 38,214 5,816 7,321 2,606 8,805 Commitments and contingencies Equity: Common stock Capital in excess of par value Retained earnings 317 1,805 90,021 323 2,462 85,777