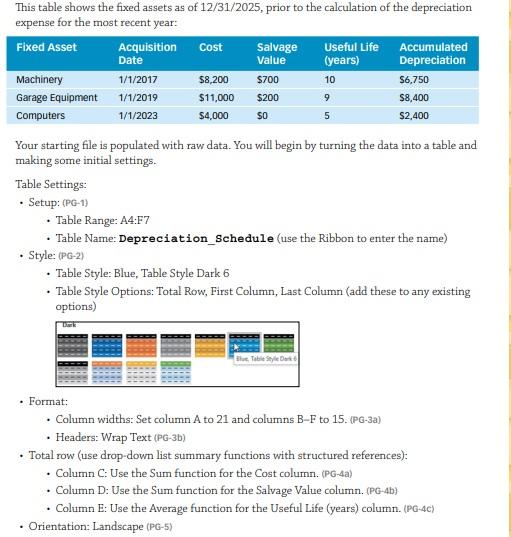
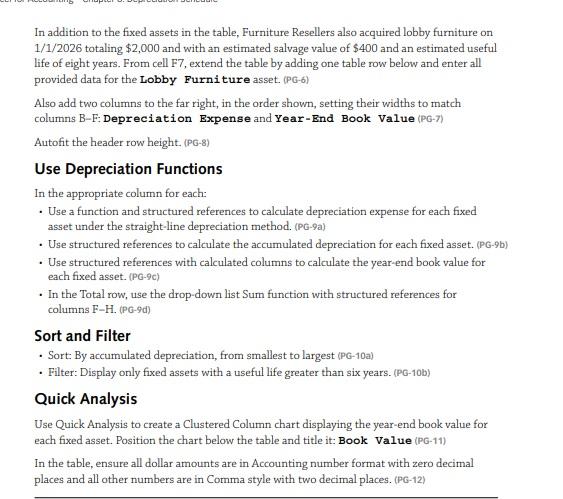
This table shows the fixed assets as of 12/31/2025, prior to the calculation of the depreciation expense for the most recent year: Your starting file is populated with raw data. You will begin by turning the data into a table and making some initial settings. Table Settings: - Setup:(PG-1) - Table Range: A4:F7 - Table Name: Depreciation_Schedule (use the Ribbon to enter the name) - Style: (PG2) - Table Style: Blue, Table Style Dark 6 - Table Style Options: Total Row, First Column, Last Column (add these to any existing options) - Format: - Column widths: Set column A to 21 and columns B-F to 15. (PG-3a) - Headers: Wrap Text (PG-3b) - Total row (use drop-down list summary functions with structured references): - Column C: Use the Sum function for the Cost column. (PG-4a) - Column D: Use the Sum function for the Salvage Value column. (PG-4b) - Column E: Use the Average function for the Useful Life (years) column. (PG-4C) - Orientation: Landscape (PG5) In addition to the fixed assets in the table, Furniture Resellers also acquired lobby furniture on 1/1/2026 totaling $2,000 and with an estimated salvage value of $400 and an estimated useful life of eight years. From cell F7, extend the table by adding one table row below and enter all provided data for the Lobby Furniture asset. (PG6) Also add two columns to the far right, in the order shown, setting their widths to match columns B-F: Depreciation Expense and Year-End Book Value (PG-7) Autofit the header row height. (PG-8) Use Depreciation Functions In the appropriate column for each: - Use a function and structured references to calculate depreciation expense for each fixed asset under the straight-line depreciation method. (PG-9a) - Use structured references to calculate the accumulated depreciation for each fixed asset. (PG-9b) - Use structured references with calculated columns to calculate the year-end book value for each fixed asset. (PG-9c) - In the Total row, use the drop-down list Sum function with structured references for columns F-H. (PG-9d) Sort and Filter - Sort: By accumulated depreciation, from smallest to largest (PG-10a) - Filter: Display only fixed assets with a useful life greater than six years. (PG-10b) Quick Analysis Use Quick Analysis to create a Clustered Column chart displaying the year-end book value for each fixed asset. Position the chart below the table and title it: Book Value (PG-11) In the table, ensure all dollar amounts are in Accounting number format with zero decimal places and all other numbers are in Comma style with two decimal places. (PG-12)