This week we will review what we've covered this semester. I will not be putting the commands you should use in this document, but your
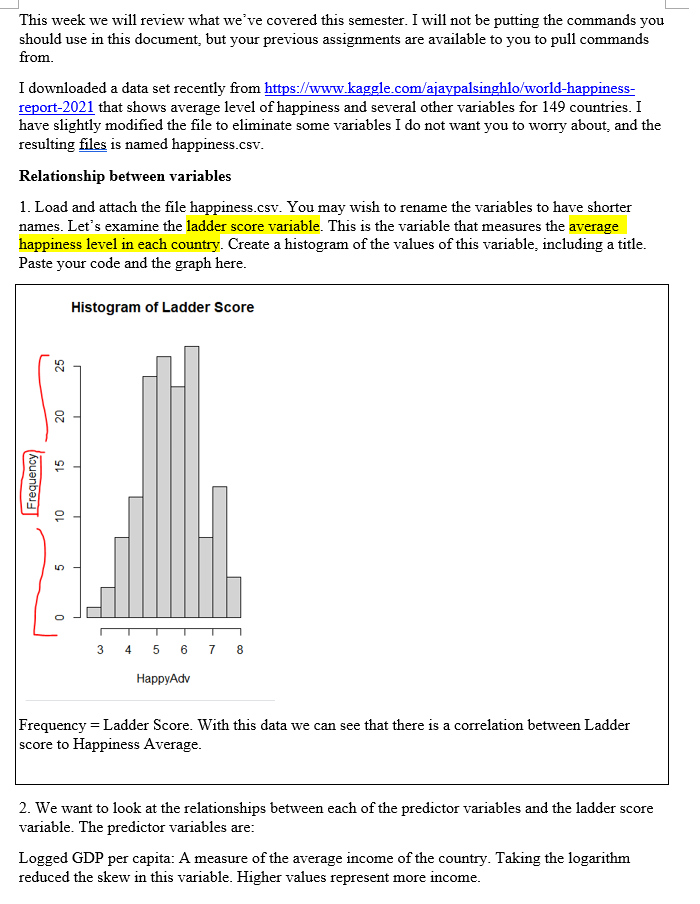
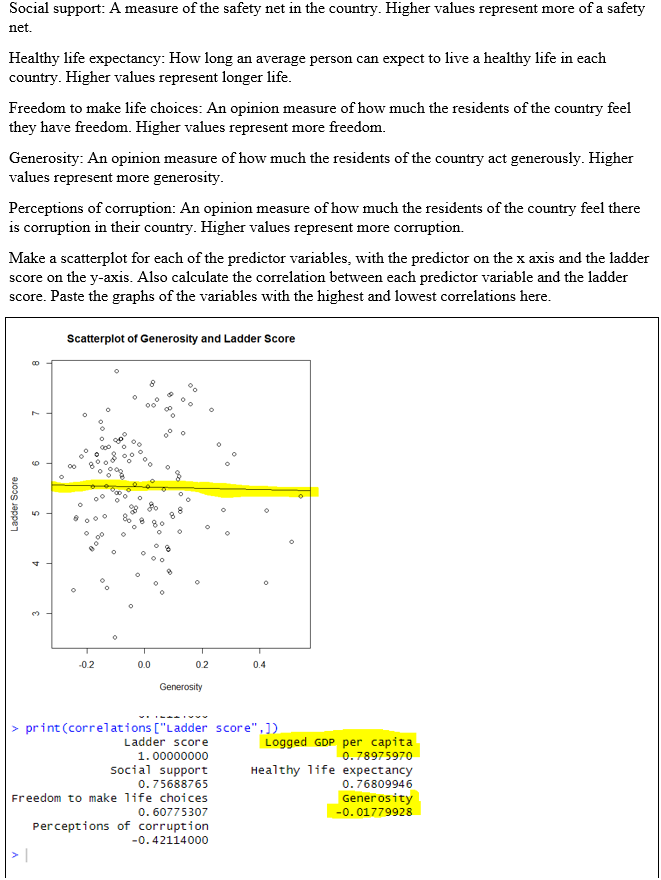
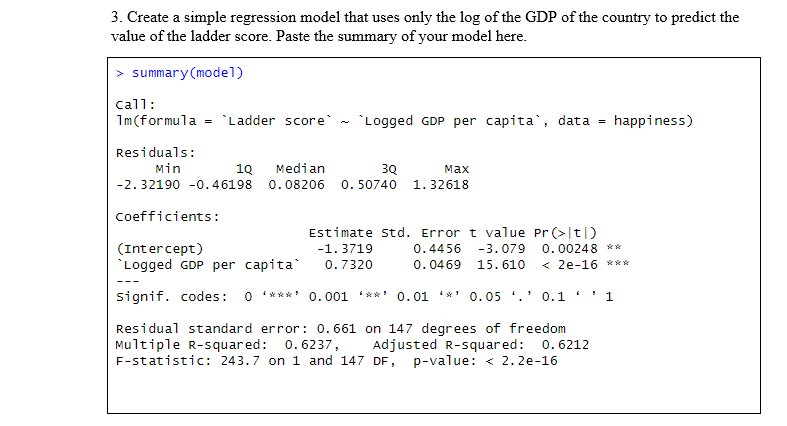
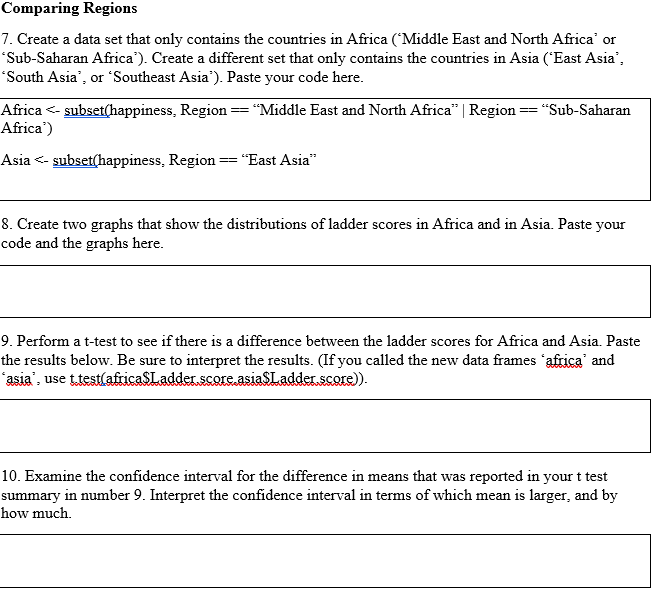
This week we will review what we've covered this semester. I will not be putting the commands you should use in this document, but your previous assignments are available to you to pull commands from. I downloaded a data set recently from https://www.kaggle.com/ajaypalsinghlo/world-happiness- report-2021 that shows average level of happiness and several other variables for 149 countries. I have slightly modified the file to eliminate some variables I do not want you to worry about, and the resulting files is named happiness.csv. Relationship between variables 1. Load and attach the file happiness.csv. You may wish to rename the variables to have shorter names. Let's examine the ladder score variable. This is the variable that measures the average happiness level in each country. Create a histogram of the values of this variable, including a title. Paste your code and the graph here. Histogram of Ladder Score Frequency 2 3 5 6 7 HappyAdv Frequency = Ladder Score. With this data we can see that there is a correlation between Ladder score to Happiness Average. 2. We want to look at the relationships between each of the predictor variables and the ladder score variable. The predictor variables are: Logged GDP per capita: A measure of the average income of the country. Taking the logarithm reduced the skew in this variable. Higher values represent more income.Social support: A measure of the safety net in the country. Higher values represent more of a safety net Healthy life expectancy: How long an average person can expect to live a healthy life in each country. Higher values represent longer life. Freedom to make life choices: An opinion measure of how much the residents of the country feel they have freedom. Higher values represent more freedom Generosity: An opinion measure of how much the residents of the country act generously. Higher values represent more generosity. Perceptions of corruption: An opinion measure of how much the residents of the country feel there is corruption in their country. Higher values represent more corruption. Make a scatterplot for each of the predictor variables, with the predictor on the x axis and the ladder score on the y-axis. Also calculate the correlation between each predictor variable and the ladder score. Paste the graphs of the variables with the highest and lowest correlations here. Scatterplot of Generosity and Ladder Score Ladder Score 02 0.0 0.2 0.4 Generosity > print (correlations ["Ladder score", ]) Ladder score Logged GDP per capita 1. 00000000 0. 78975970 Social support Healthy life expectancy 0. 75688765 0. 76809946 Freedom to make life choices Generosity 0. 60775307 -0. 01779928 perceptions of corruption -0. 421140003. Create a simple regression model that uses only the log of the GDP of the country to predict the value of the ladder score. Paste the summary of your model here. > summary (model) Call : 1m(formula = *Ladder score* ~ `Logged GDP per capita', data = happiness) Residuals: Min Median 30 Max -2. 32190 -0. 46198 0. 08206 0. 50740 1. 32618 Coefficients : Estimate Std. Error t value pr (>|t/) (Intercept) -1. 3719 0. 4456 -3. 079 0. 00248 * * `Logged GDP per capita" 0. 7320 0. 0469 15. 610
Step by Step Solution
There are 3 Steps involved in it
Step: 1
Get Instant Access to Expert-Tailored Solutions
See step-by-step solutions with expert insights and AI powered tools for academic success
Step: 2
Step: 3
Ace Your Homework with AI
Get the answers you need in no time with our AI-driven, step-by-step assistance