Answered step by step
Verified Expert Solution
Question
1 Approved Answer
Three cards are drawn (simultaneously) from a deck. The number of jacks is counted. The probability distribution is shown below. Draw a histogram for this
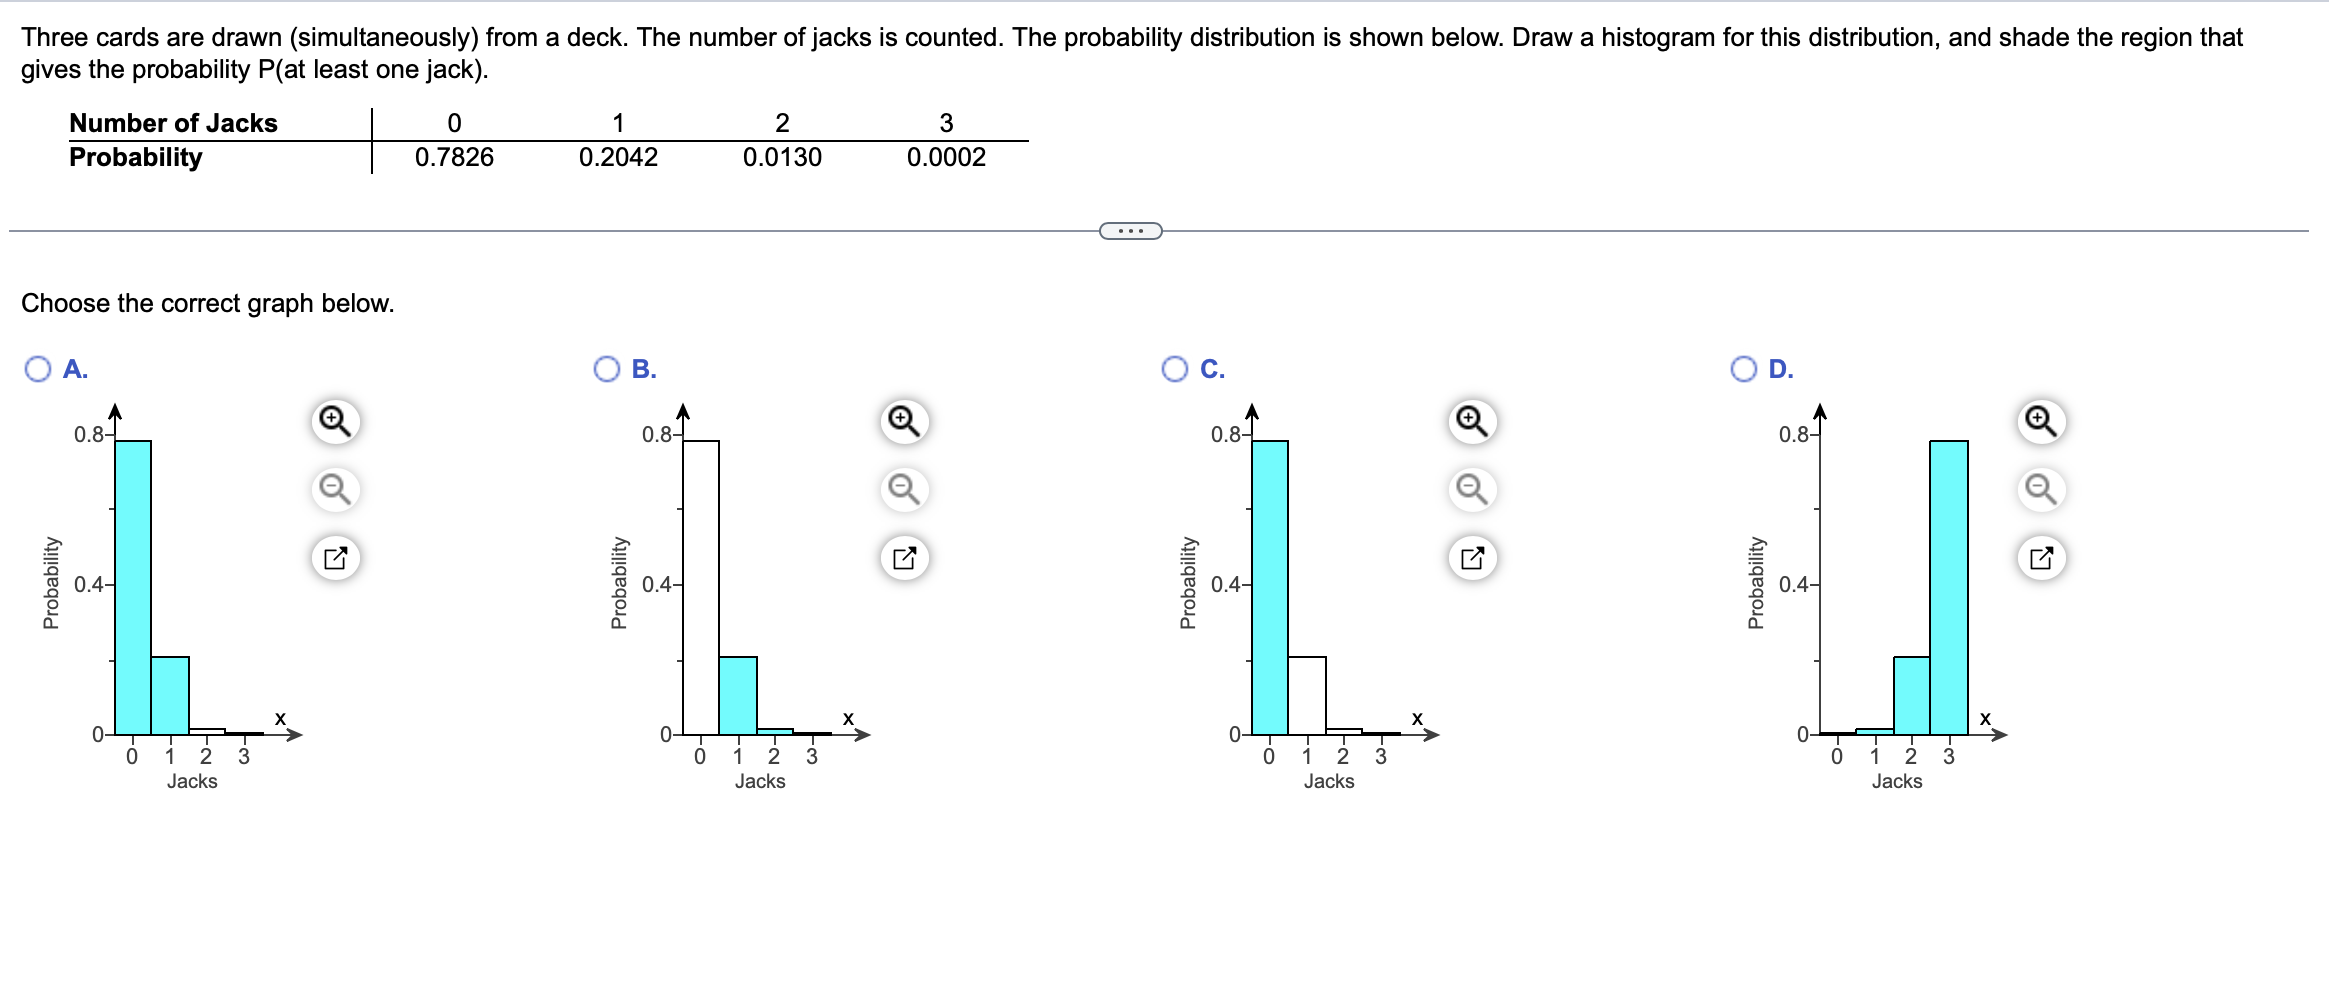
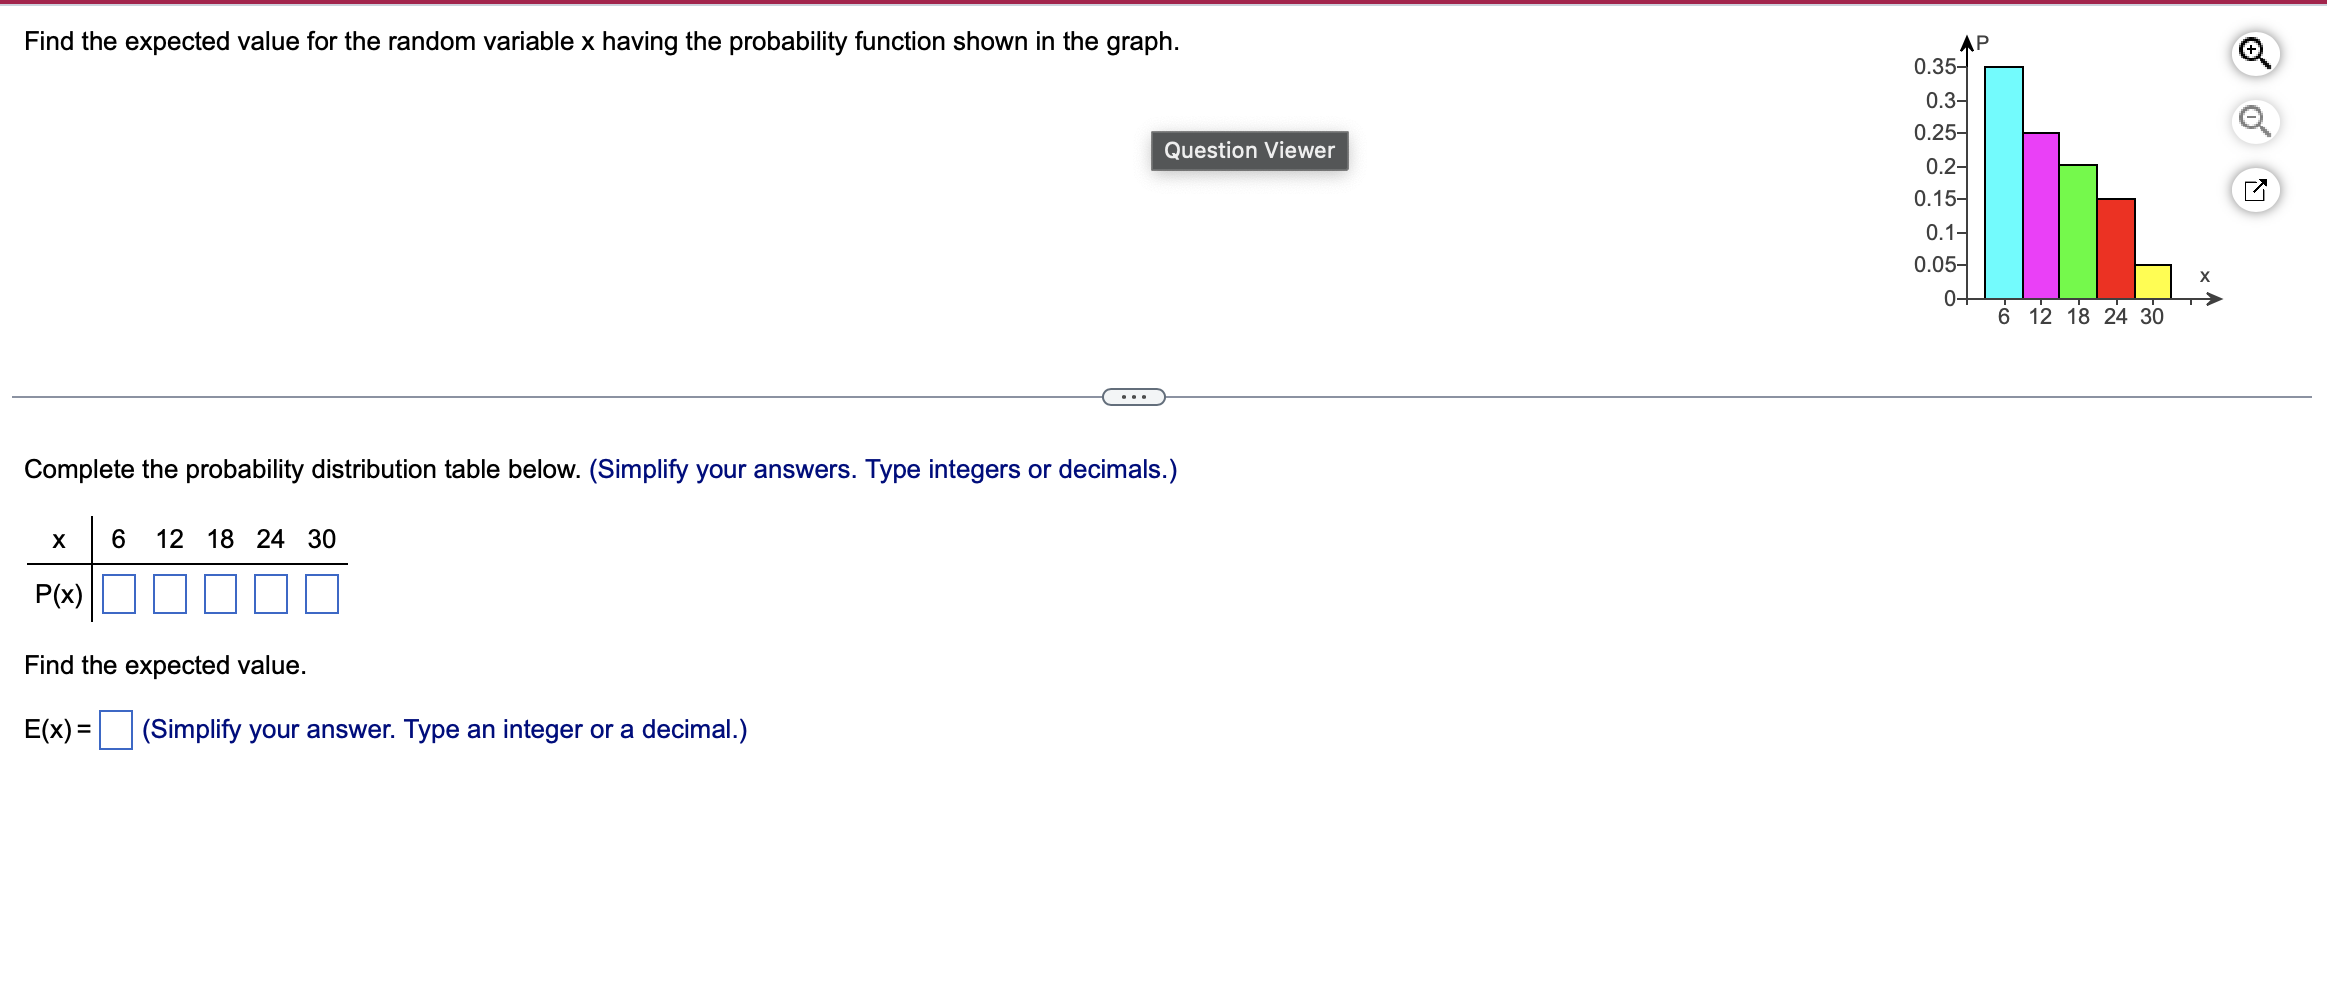
Three cards are drawn (simultaneously) from a deck. The number of jacks is counted. The probability distribution is shown below. Draw a histogram for this distribution, and shade the region that gives the probability P(at least one jack). Number of Jacks | 0 1 2 3 Probability | 07826 0.2042 0.0130 0.0002 Choose the correct graph below. O O B. Oc ) D. A A 0.8 Q 0.8 Q 0.8 Q 0.8 Q Q Q Q Q z z z = = = z = z o s 041 s 04 s 04 o o o o a a Probability o + Find the expected value for the random variable x having the probability function shown in the graph. Question Viewer 0.35 0.3 0.25 0.2 0.15 0.1 0.05 6 12 18 24 30 o P Complete the probability distribution table below. (Simplify your answers. Type integers or decimals.) 6 12 18 24 30 P(x) Find the expected value. E(x)= (Simplify your answer. Type an integer or a decimal.) Fill in the missing value to make a valid probability distribution. x | 20 | 30 P(x) [ 0.11 | 0.27 50 0.39 What is the missing probability? (Type an integer or a decimal.)
Step by Step Solution
There are 3 Steps involved in it
Step: 1
Get Instant Access to Expert-Tailored Solutions
See step-by-step solutions with expert insights and AI powered tools for academic success
Step: 2
Step: 3
Ace Your Homework with AI
Get the answers you need in no time with our AI-driven, step-by-step assistance
Get Started