Question
Threshold-based Classifier There are two classes of data points, where each point is represented by two features (x,y). Assume that there are data points in
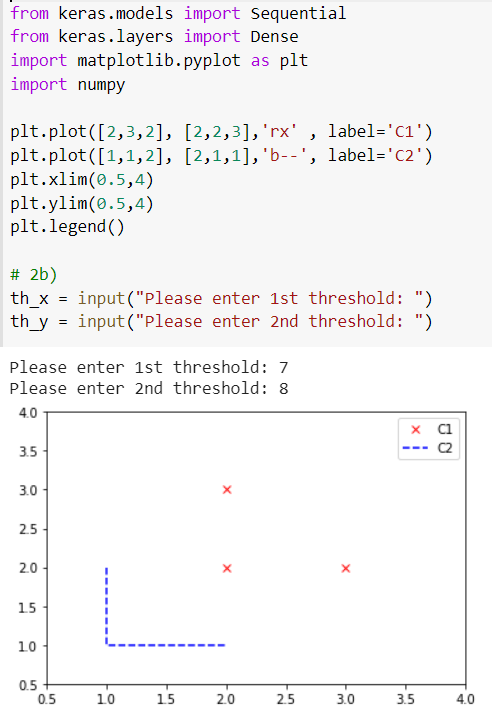
Threshold-based Classifier There are two classes of data points, where each point is represented by two features (x,y). Assume that there are data points in each class: C1={(2, 2), (3, 2), (2, 3)}; C2={(1, 2), (1, 1), (2, 1)} and perform the followings in Python: a) Plot the data points. The data points in class C1 and C2 have to be in two different colors and shapes. Label the axes and add legends as appropriate. b) The code asks the user to enter two thresholds thx and thy. c) Your code calculates and prints the training accuracy based on the selected thresholds. To do so, assume that for any data point (x,y) with x> thx and y> thy, the data point belongs to C1, and to C2 if otherwise. Using this rule and the user-selected thresholds, the code calculates the training accuracy as the number of correctly classified data points over the total number of data points (6 in here). I've done parts a and b, but am confused on part c...  code:
code:
from keras.models import Sequential from keras.layers import Dense import matplotlib.pyplot as plt import numpy
plt.plot([2,3,2], [2,2,3],'rx' , label='C1') plt.plot([1,1,2], [2,1,1],'b--', label='C2') plt.xlim(0.5,4) plt.ylim(0.5,4) plt.legend()
# 2b)
th_x = input("Please enter 1st threshold: ") th_y = input("Please enter 2nd threshold: ")
from keras.models import Sequential from keras.layers import Dense import matplotlib.pyplot as plt import numpy plt.plot([2,3,2), (2,2,3],'rx' , label='c1') plt.plot([1,1,2], [2,1,1],'b--', label='c2') plt.xlim(0.5,4) plt.ylim(0.5,4) plt.legend() # 2b) th_x = input("Please enter 1st threshold: ") th_y = input("Please enter and threshold: ") Please enter 1st threshold: 7 Please enter and threshold: 8 4.0 0505 10 15 20 25 30 35 40 from keras.models import Sequential from keras.layers import Dense import matplotlib.pyplot as plt import numpy plt.plot([2,3,2), (2,2,3],'rx' , label='c1') plt.plot([1,1,2], [2,1,1],'b--', label='c2') plt.xlim(0.5,4) plt.ylim(0.5,4) plt.legend() # 2b) th_x = input("Please enter 1st threshold: ") th_y = input("Please enter and threshold: ") Please enter 1st threshold: 7 Please enter and threshold: 8 4.0 0505 10 15 20 25 30 35 40Step by Step Solution
There are 3 Steps involved in it
Step: 1

Get Instant Access to Expert-Tailored Solutions
See step-by-step solutions with expert insights and AI powered tools for academic success
Step: 2

Step: 3

Ace Your Homework with AI
Get the answers you need in no time with our AI-driven, step-by-step assistance
Get Started


