

Question
Throughout this course you have seen how reading and understanding a companys financial statements, and analyzing ratios based on the reported numbers, can provide valuable
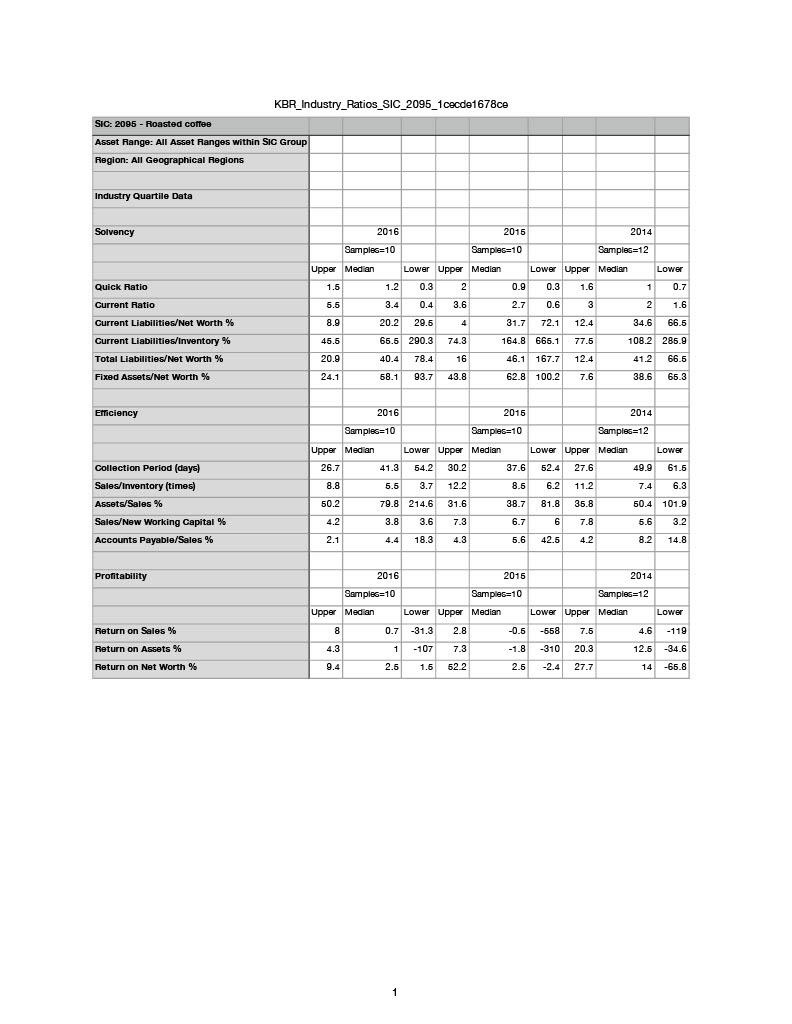
Throughout this course you have seen how reading and understanding a companys financial statements, and analyzing ratios based on the reported numbers, can provide valuable about the financial condition of the company. Lesson 14 discusses additional resources for analyzing a company and comparing its results with other companies or industries. For this discussion, please look at one of the resources mentioned in the lesson either an online database or financial site mentioned in the Industry Information section, or an annual report or 10-K form for any company. Find an interesting fact or comparison to discuss. You may browse until you find something interesting, or look up something specific about a particular company or industry. Discuss how the information you found enhances your understanding of the company or industry beyond the reported numbers in the financial statements.
Step by Step Solution
There are 3 Steps involved in it
Step: 1

Get Instant Access to Expert-Tailored Solutions
See step-by-step solutions with expert insights and AI powered tools for academic success
Step: 2

Step: 3
Ace Your Homework with AI
Get the answers you need in no time with our AI-driven, step-by-step assistance
Get Started
Intermediate accounting
Authors: J. David Spiceland, James Sepe, Mark Nelson
7th edition
978-0077614041, 9780077446475, 77614046, 007744647X, 77647092, 978-0077647094