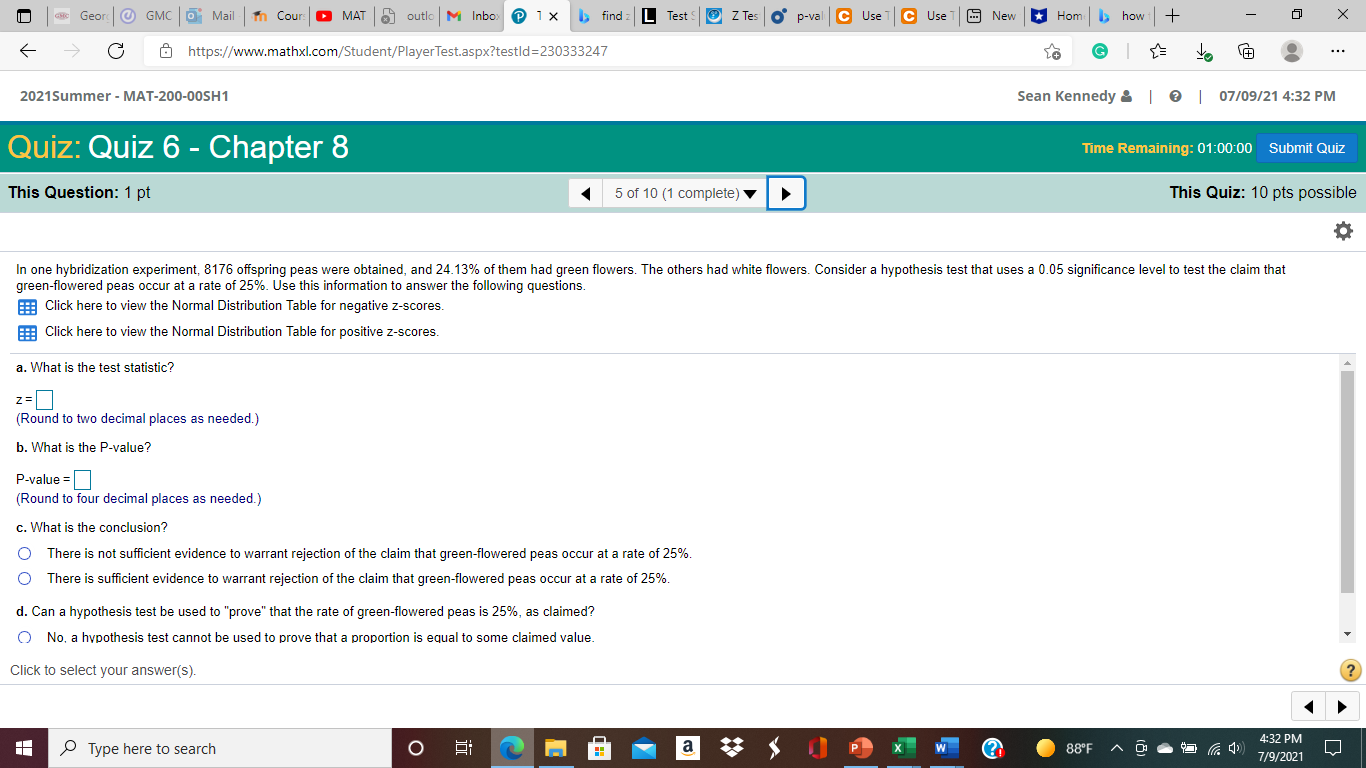
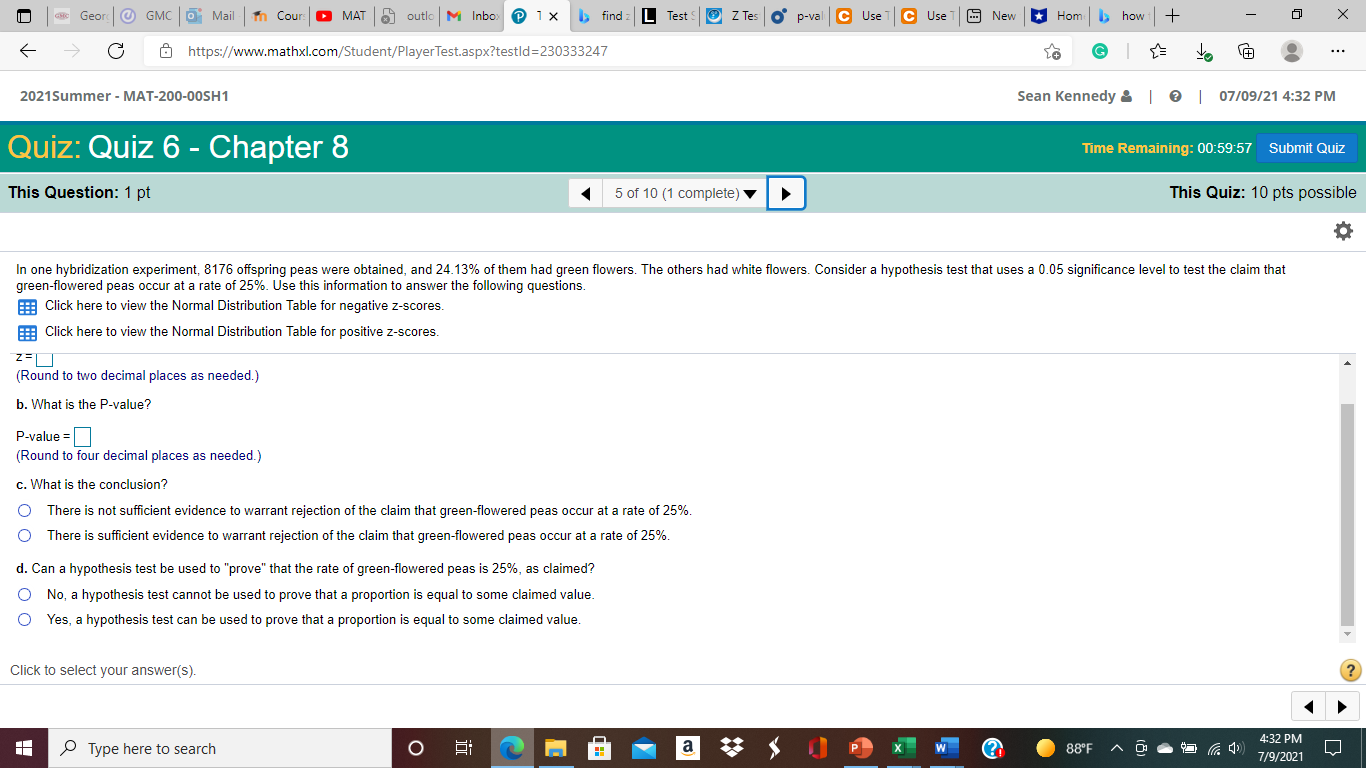
THX Gear GMC |0 Mail |In Cours MAT 8) outlo M Inbox Pix b findz L Tests|@ Z Tes O' p-val |C Use T C Use T| New * Hom | how + X C https://www.mathxl.com/Student/PlayerTest.aspx?testld=230333247 G to ... 2021Summer - MAT-200-00SH1 Sean Kennedy & | @ | 07/09/21 4:32 PM Quiz: Quiz 6 - Chapter 8 Time Remaining: 01:00:00 Submit Quiz This Question: 1 pt 5 of 10 (1 complete) This Quiz: 10 pts possible In one hybridization experiment, 8176 offspring peas were obtained, and 24.13% of them had green flowers. The others had white flowers. Consider a hypothesis test that uses a 0.05 significance level to test the claim that green-flowered peas occur at a rate of 25%. Use this information to answer the following questions. Eff Click here to view the Normal Distribution Table for negative z-scores. Click here to view the Normal Distribution Table for positive z-scores. a. What is the test statistic? z= (Round to two decimal places as needed.) b. What is the P-value? P-value = (Round to four decimal places as needed.) c. What is the conclusion? O There is not sufficient evidence to warrant rejection of the claim that green-flowered peas occur at a rate of 25%. O There is sufficient evidence to warrant rejection of the claim that green-flowered peas occur at a rate of 25%. d. Can a hypothesis test be used to "prove" that the rate of green-flowered peas is 25%, as claimed? O No, a hypothesis test cannot be used to prove that a proportion is equal to some claimed value. Click to select your answer(s). ? 1 Type here to search O a ( P x W ? 880F A D 24 4:32 PM 7/9/2021THX Gear GMC |0 Mail |In Cours MAT 8) outlo M Inbox Pix b findz L Tests|@ Z Tes O' p-val |C Use T C Use T| New * Hom | how + X C https://www.mathxl.com/Student/PlayerTest.aspx?testld=230333247 G to ... 2021Summer - MAT-200-00SH1 Sean Kennedy & | @ | 07/09/21 4:32 PM Quiz: Quiz 6 - Chapter 8 Time Remaining: 00:59:57 Submit Quiz This Question: 1 pt 5 of 10 (1 complete) This Quiz: 10 pts possible In one hybridization experiment, 8176 offspring peas were obtained, and 24.13% of them had green flowers. The others had white flowers. Consider a hypothesis test that uses a 0.05 significance level to test the claim that green-flowered peas occur at a rate of 25%. Use this information to answer the following questions. Click here to view the Normal Distribution Table for negative z-scores. Click here to view the Normal Distribution Table for positive z-scores. Z= (Round to two decimal places as needed.) b. What is the P-value? P-value = (Round to four decimal places as needed.) c. What is the conclusion? O There is not sufficient evidence to warrant rejection of the claim that green-flowered peas occur at a rate of 25%. O There is sufficient evidence to warrant rejection of the claim that green-flowered peas occur at a rate of 25%. d. Can a hypothesis test be used to "prove" that the rate of green-flowered peas is 25%, as claimed? O No, a hypothesis test cannot be used to prove that a proportion is equal to some claimed value. O Yes, a hypothesis test can be used to prove that a proportion is equal to some claimed value. Click to select your answer(s). ? 1 880F A D 24 4:32 PM Type here to search O 7/9/2021


